


Steering your online store toward sustained growth requires more than just tracking basic data from sales reports. You need to create reports that show important metrics of your financial health like average order value trends over time in WooCommerce.
Analyzing Average Order Value (AOV) trends unlocks actionable insights into customer behavior, marketing effectiveness, and pricing strategy success.
In this guide, we will walk you through two methods to create, visualize, and automate AOV trend reports for your WooCommerce store:
- Built-in analytical tools in WooCommerce
- REPORTiT – Advanced Reporting for WooCommerce plugin
Let’s dive into it.
What Is Average Order Value (AOV) in WooCommerce?
AOV is one of the fundamental metrics in WooCommerce that measures the average amount spent each time a customer places an order.
You can calculate AOV manually using a simple formula:
AOV = Total Revenue / Number of Orders
Why Tracking AOV Trends Over Time Matters؟
A single AOV has no power for revealing what is really going on in your ecommerce store. You can only have deep insights about your store performance when observing average order value trends over time in WooCommerce.
A progressive trend in AOV over time means your strategies for increasing per-customer revenue are working. Otherwise, you must consider it as an early warning sign to investigate.
Tracking the AOV trend helps you:
- Evaluate the direct impact of promotions, bundling, or free-shipping thresholds.
- Measure the success of upselling and cross-selling campaigns.
- Recognize shifts in customer preferences or product combinations.
Key Drivers of AOV in Your Store
There are many factors directly influence your average order value trends over time:
- Upselling & Cross-selling: Displaying premium products or related items at checkout.
- Product Bundling: Offering discounts or free gifts to encourage customers to order sets of complementary products.
- Free Shipping Thresholds: Encouraging customers to add more items to their cart to qualify.
- Minimum Order Values: Enforcing a base spend amount.
- Pricing Strategy: Changes in the price of best-selling items.
How to create reports that show average order value trends over time in WooCommerce?
To effectively analyze your store’s performance, tracking how your Average Order Value (AOV) changes over time is crucial. In this guide, we will walk you through two practical methods to create these trend reports: a manual method using WooCommerce’s built-in exports and a more automated approach using a dedicated plugin.
Method #1: Using WooCommerce’s Built-in Analytics Dashboard
If you are running a small business in WooCommerce, using WooCommerce Analytics and calculating the AOV manually is a perfect way for getting started with basic data.
To find Sales Data in WooCommerce Analytics, follow the below steps:
- Navigate to WooCommerce > Analytics in your WordPress admin.
- Set the date range for example last month.
- Generate the following reports:
- Revenue: To see the total sales over the selected period.
- Orders: To observe the total number of orders placed.
- Calculate the AOV for the specified date:
AOV = Net Sales / Orders.
- Repeat these steps for another period like This month.
- Plot the numbers in a spreadsheet and analyze the average order value trends over time.
Limitations of Default WooCommerce AOV Reports
Although WooCommerce Analytics provides useful reports for evaluating the store performance, it has limitations specially for big ecommerce stores looking for deeper insights about important metrics:
- No Automated AOV Metric: There is no report or chart to show average order value trends over time.
- No Visualization: You cannot see an automatic line or bar graph of AOV over time.
- Limited Segmentation: There is no option to compare AOV trends for different customer groups or product categories without manual work.
Method #2: How to Create AOV Trend Reports in WooCommerce with REPORTiT
The REPORTiT – Advanced Reporting for WooCommerce plugin excels by providing more than 50 sales report you can generate with one click to overview the most important data including real-time AOV trends.
For professional, and automated AOV trend analysis, REPORTiT is a powerful solution with a lot of customization and visualization options.
Let’s see how you can create reports that show average order value trends over time in this powerful plugin.
Step-by-Step: Creating Your First AOV Trend Report in REPORTiT Plugin
Follow these steps to build sales reports displaying AOV trends:
Step 1: Install & Activate the Plugin
First, you need to purchase the REPORTiT plugin and download the ZIP file with license. Then, you can install, and activate it through WordPress Dashboard > Plugins > Add New > Install.
Step 2: Access Report Builder
Go to WordPress Dashboard > iThemeland > REPORTiT.
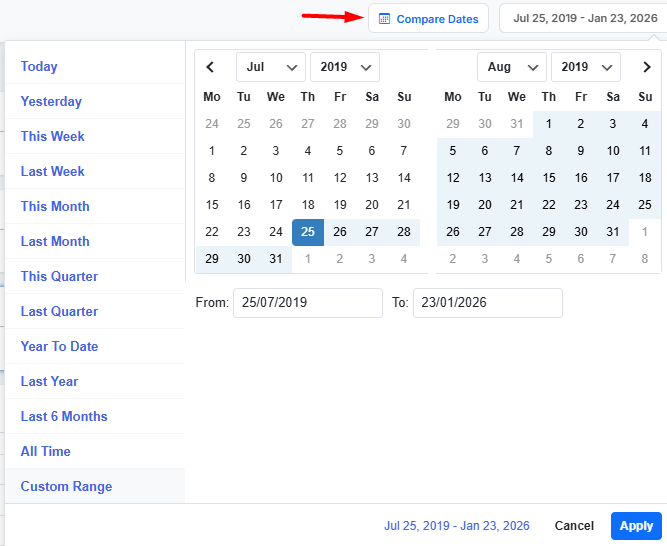
Step 3: Choosing the Right Date Range for AOV Analysis
Use the preset list to specify the date range for generating sales report or set a custom date range in the built in calendar.
You can even set Compare Dates to review average order value trends over the comparative dates.
Step 4. Select preferred sales report
The plugin provides a list of useful sales reports at the left menu. You can choose one of the reports to lead the plugin automatically gather data from your store and display the Chart and Table reports.
To create reports that show average order value trends over time in WooCommerce, you can generate one of the following reports:
Show average order value trends over time in Revenue Report
Under the Revenue menu, you can follow the instructions below to see average order value trends over time:
- Click on the Revenue report.
- Click on the AOV cart.
- Apply filters by products, Country, etc. to see AOV trends for a specific item.
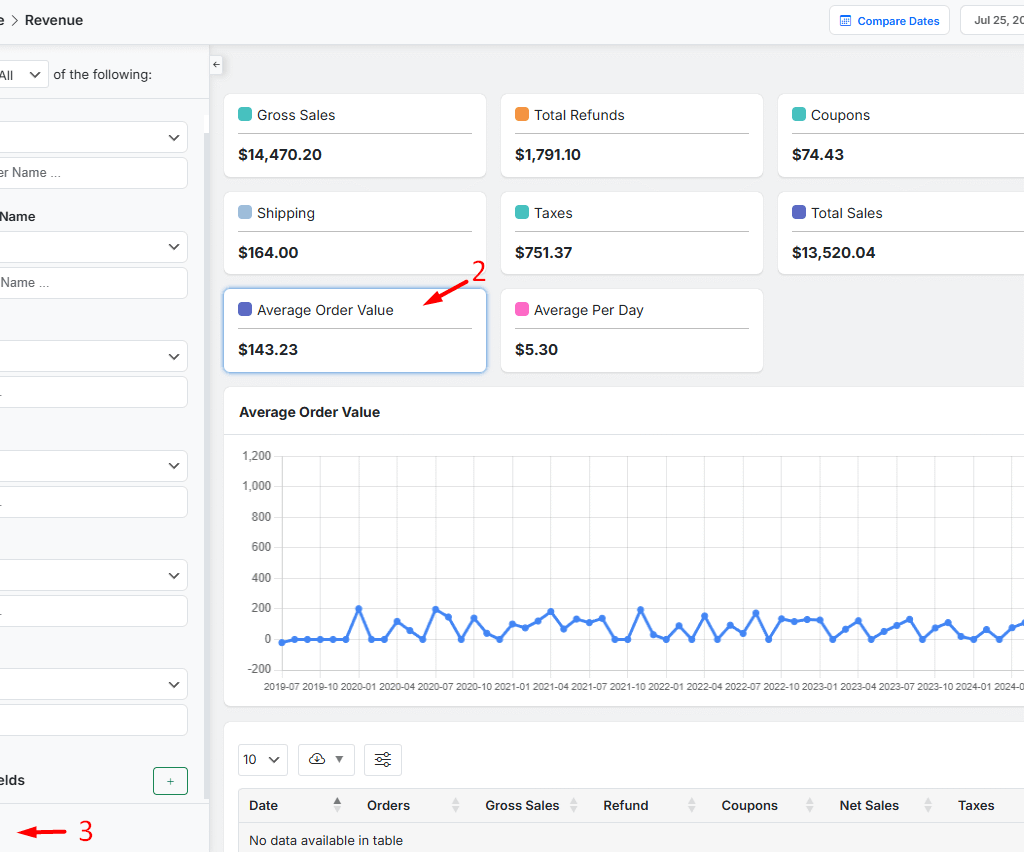
Once the filter is applied, you can see a visual chart and a table report.
The visual chart is very helpful to track average order value trends over time.
The table report allows you to see which orders are driving AOV changes.
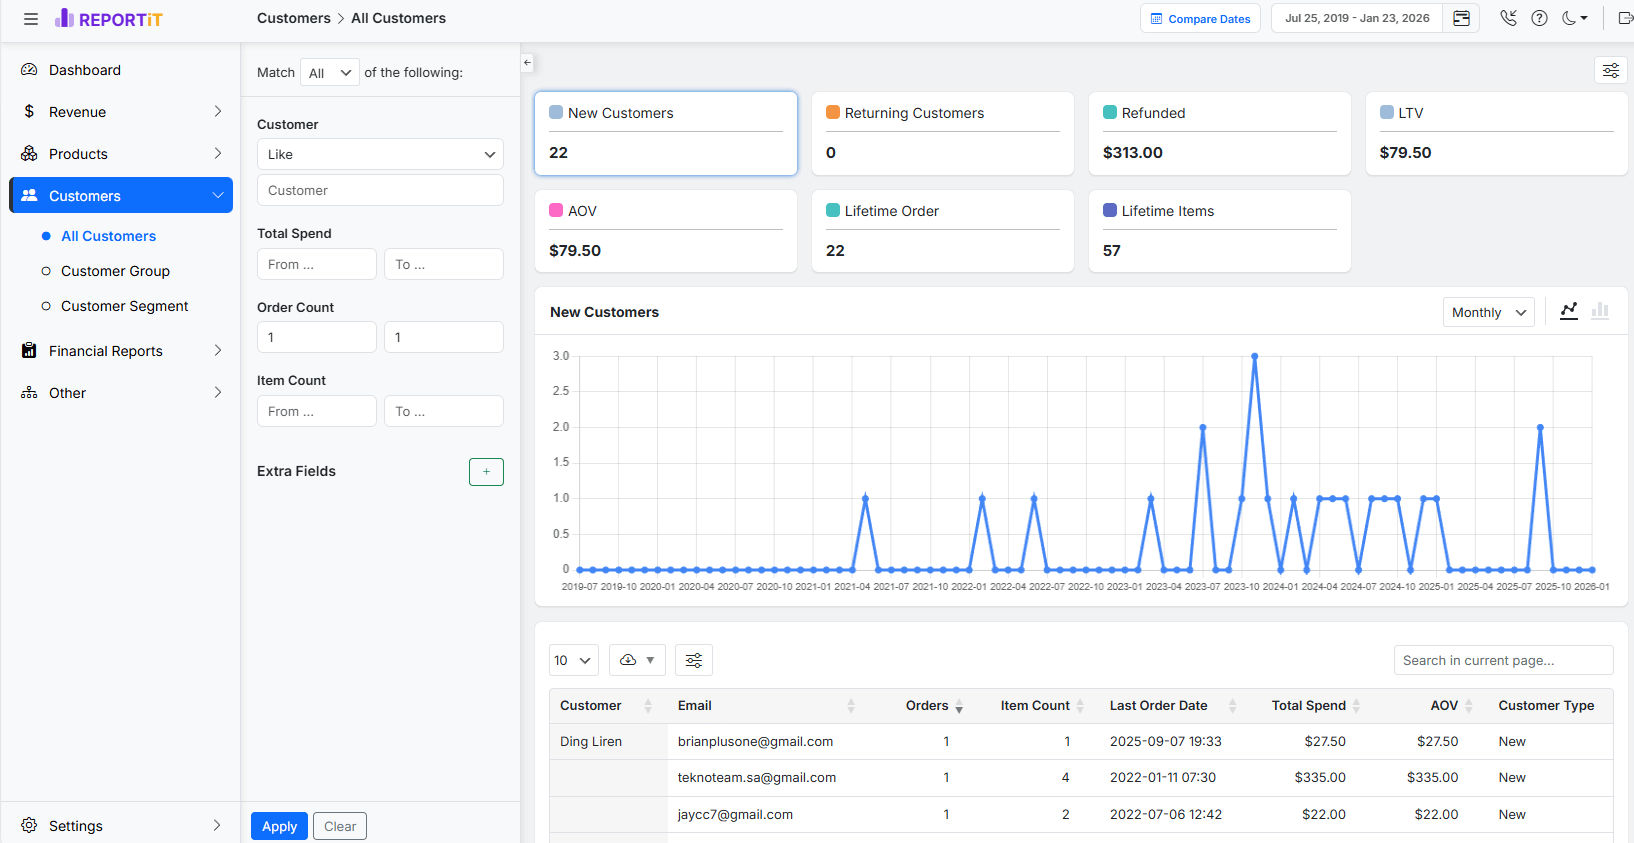
Show average order value trends over time in Customer Report
To generate a customer report, navigate to Customer > All Customers in the menu.
Just like the revenue report, you can set your desired filters and click on the AOV cart to see the trends over time.
You can also analyze the AOV per customer by reviewing the table report as shown below:
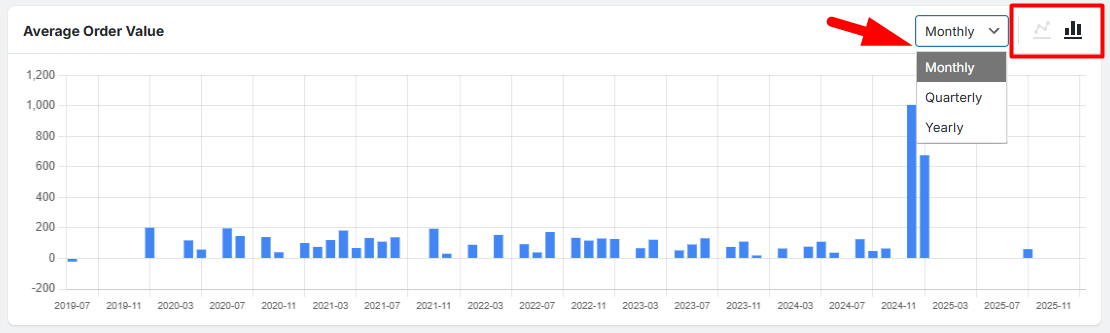
5. Visualizing AOV Trends with Charts and Graphs
One of the amazing features of the REPORTiT plugin is the visual chart of each report which is fully customizable.
You can switch the AOV chart to be displayed as a Line Chart or a Bar chart.
It is also possible to see the average order value trends over time. (Monthly, Quarterly, Yearly)
REPORTiT – Advanced WooCommerce Reporting
The easy way to track financial health and spot growth opportunities with WooCommerce average order value trends.
Best practices to analyze AOV Trend Reports
Analyzing average order value trends is not a one time task. You have to track the changes over time regularly to ensure your online store is making progress or recognize if there is any required action to take.
REPORTiT comes with essential features to help you automate the track of AOV trends. Let’s see how:
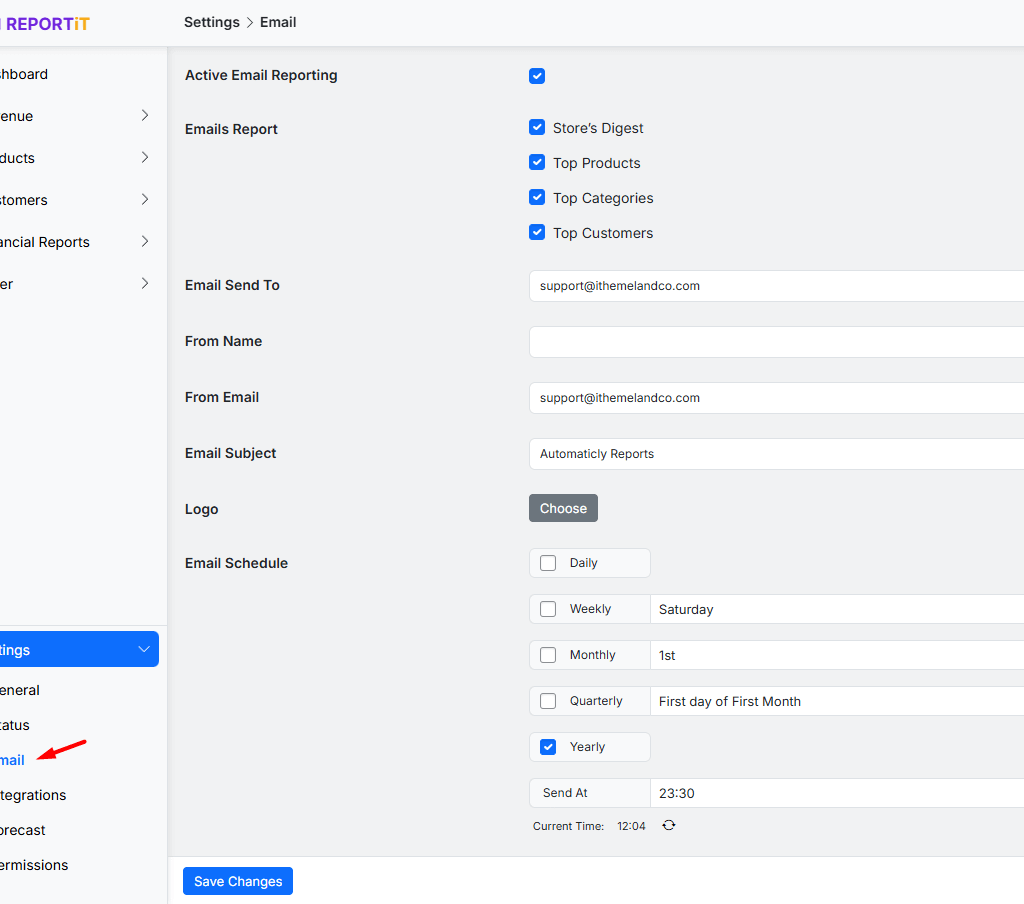
Scheduling Automatic AOV Report Emails
At REPORTiT’s plugin setting, look for the Email feature. By activating this feature, you can:
- Set the frequency of receiving sales report (e.g., Every Monday at 9 AM).
- Enter the email addresses of managers or stakeholders.
- Choose the types of sales report to send (Daily, Weekly, etc.)
- Save the schedule to receive the AOV trend report automatically.
Read More: Send automated sales report email in WooCommerce?(2 practical methods)
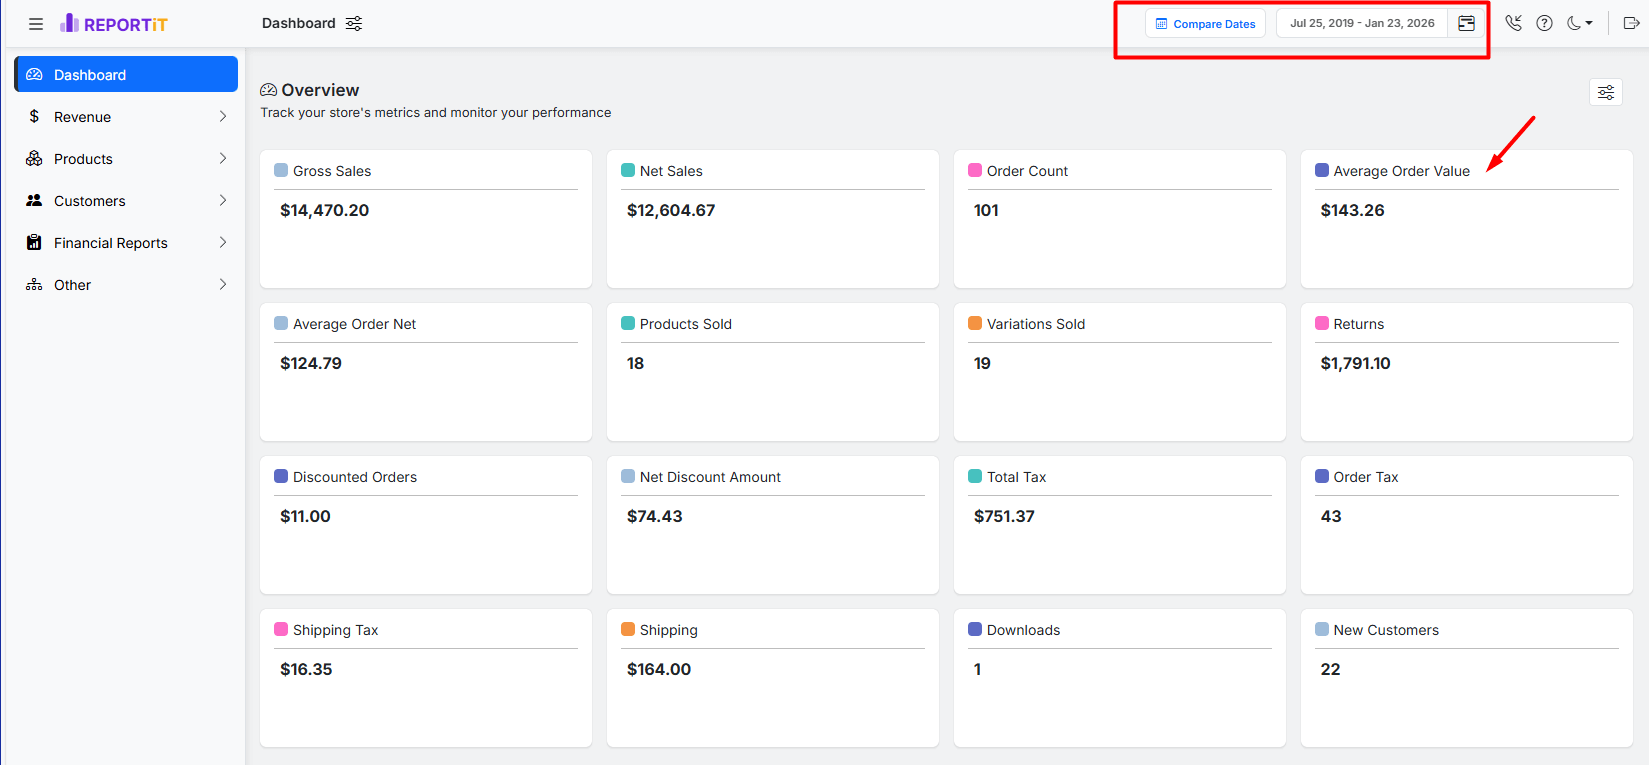
Customize the Dashboard to show average order value trends over time
To easily track the AOV trends every time you go to the REPORTiT plugin dashboard (With no need to generate reports), you can add the Average Order Value cart to the Overview section.
So just by specifying the Date Range at the top of the page, you can see the AOV related to the specified period in the Dashboard at one glance.
REPORTiT – Advanced WooCommerce Reporting
The easy way to track financial health and spot growth opportunities with WooCommerce average order value trends.
Troubleshooting Common Reporting Issues
Conclusion
Tracking Average Order Value trends over time is a cornerstone of smart WooCommerce management. For big ecommerce stores, manual calculations are an overwhelming process that wastes their time and effort. To automate generating AOV reports, you can use REPORTiT as a powerful tool to have a clear visual narrative of your store’s performance.
Start using REPORiT plugin today to effectively create the sales reports showing key metrics like AOV trend and scheduling to receive them in your Email regularly.
FAQs About AOV Trend Reports in WooCommerce
Q: What’s the difference between AOV and Customer Lifetime Value (LTV)?
A: AOV indicates the value of a single transaction while LTV calculates the total revenue a single customer can have during the time purchasing from your store. A rising AOV can significantly improve LTV.
Q: My AOV dropped suddenly. What are the first things I should check?
A: First, you should check if a new, low-cost product is sold rapidly in the last few weeks. Then check if the promotions are encouraging customers to buy inexpensive items. And finally pay attention to the out of stock products and try to supply high-value products out of stock.
Q: How often should I review my AOV trend report?
A: It depends on your financial strategies, however , store managers usually check a weekly review if there are immediate impacts from campaigns. Otherwise, reviewing monthly reports is common for making smart decisions and plan for necessary actions
Q: Is the REPORTiT plugin compatible with my other WooCommerce extensions?
A: REPORTiT is generally compatible with most extensions as it pulls data directly from the standard WooCommerce database tables. However, for complex custom fields from other plugins, check the REPORTiT documentation or test in a staging environment. Our technical team is always ready to answer any potential questions as well.


