


Do you know who your most valuable customers are and how to run marketing campaigns to retain their loyalty effectively? If not, you’re likely leaving significant revenue on the table. The key to online shopping success lies in precise, targeted campaigns based on the data from customer segmentation reports.
Using reports for customer segmentation, you can break down your customer base into distinct groups based on their behavior, demographics, and purchasing patterns. This process allows you to craft targeted campaigns that drive higher engagement, result in increasing customer lifetime value, and maximize your ROI.
Why Reports Matter: The Role of Data in Marketing Success
Customer segmentation reports provide the data you need to analyze for answering to answer some critical questions like:
- Who are your frequent buyers?
- What products do first-time customers purchase?
- Which geographic regions are most profitable?
Using reports for customer segmentation can lead to running targeted campaigns that effectively impact customer engagement.
Understanding Customer Segmentation: Definitions and Types
Customer segmentation is the process of categorizing your customers into groups to better address their needs.
There are four primary models to segment your customers:
- Demographic Segmentation: Categorize customers based on statistical data such as age, gender, income, occupation, or education level.
- Geographic Segmentation: Group customers by their location, such as country, city, or state.
- Role Segmentation: Categorize customers based on their user roles, such as Retailer, Sales manager, Guest, Registered Customer, etc.
- Behavioral Segmentation: Perhaps the most powerful for e-commerce, this segment customers based on their actions, including purchase history, average order value, product views, cart abandonment, and brand loyalty.
Core WooCommerce Reports for customer segmentation
WooCommerce is a goldmine of data waiting to be analyzed. However, the native WooCommerce analytics dashboard provides several foundational reports, which are not enough for deep analysis.
To start using reports for customer segmentation, you need to use the REPORTiT – Advanced Reporting for WooCommerce plugin as one of the most advanced plugins for generating customer segmentation reports.
Let’s review how you can use reports for customer segmentation in this powerful plugin:
Customer segmentation reports by purchase behavior
This report categorizes customers based on their purchasing behavior, dividing them into distinct groups such as:
- VIPs: critical customer group for allocating retention and exclusive rewards strategies
- Single Order Customers: represents a large volume of customers with lower AOV and LTV, highlighting a significant opportunity for re-engagement targeted campaigns
- Repeat customers:
- At-risk customers: signaling the need for reactivation efforts
By using reports for customer segmentation, store managers can track key trends in spending, loyalty, and churn. These insights are crucial for developing targeted campaigns and personalized engagement strategies to maximize customer LTV value and improve retention.
To generate Customer segmentation reports, you need to open the Customer menu and click on Customer Segmentation report.
The plugin will automatically report the data in a visual chart and a table.
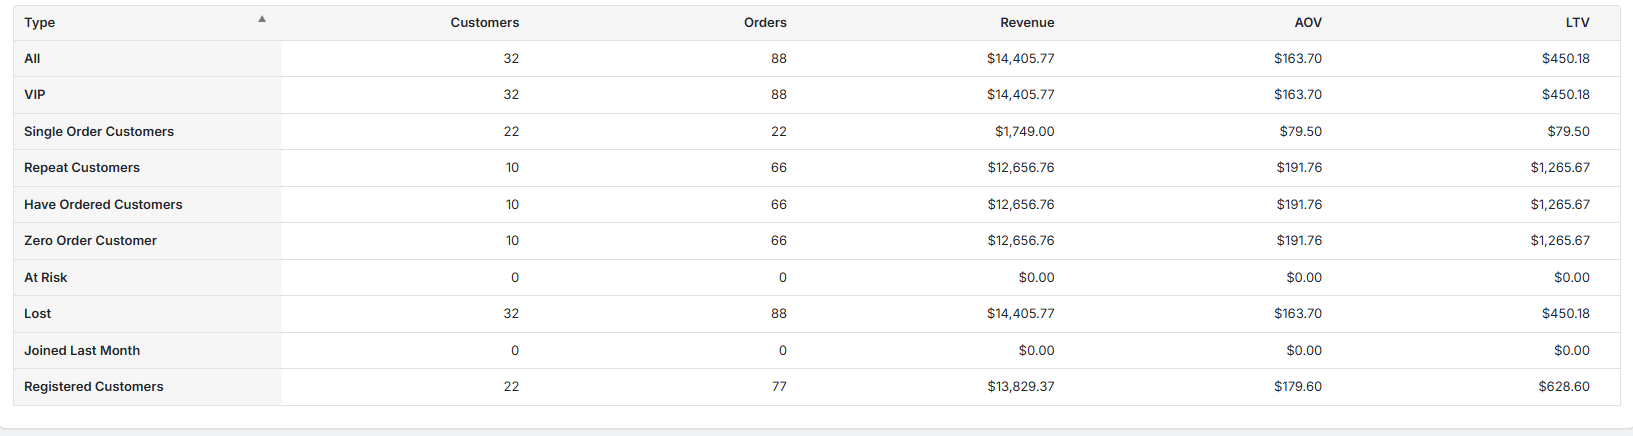
Advanced Data Points for Segmentation
The advanced metrics in this report include:
- Customer count,
- Order Count,
- Revenue,
- Average Order Value (AOV),
- and Lifetime Value (LTV)
The table report provides a granular view of each segment’s performance.
Customer segmentation reports by user role
This report segments customers based on their assigned user role, such as:
- Wholesaler,
- Retail customer,
- or Guest user.
Using reports for customer segmentation by user role helps managers to better understand the needs and behaviors of each. This insight is useful for running targeted campaigns and deciding on strategies like product offerings, support levels, and communication.
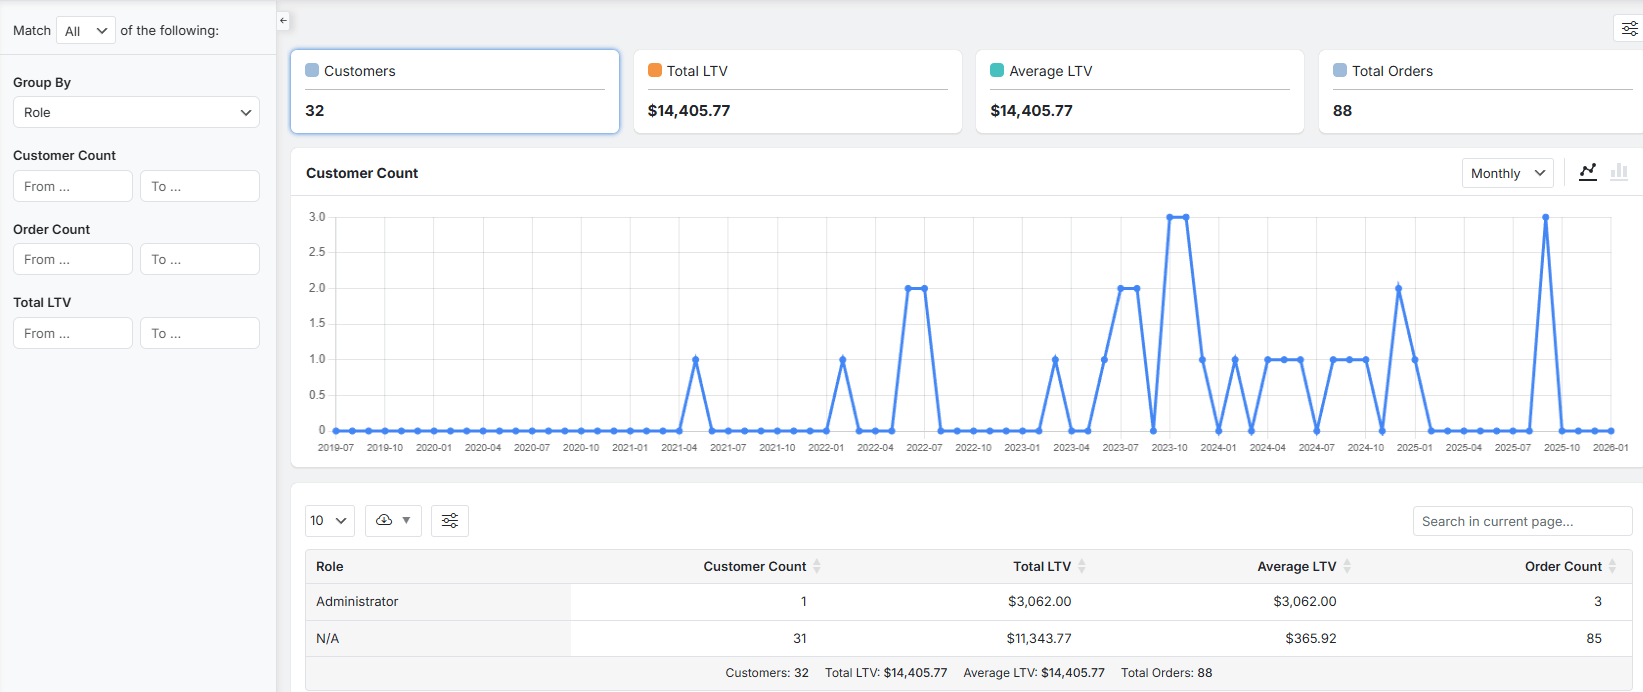
Advanced Data Points for Segmentation by user role
The advanced data points here are:
- Customer Count,
- Total LTV,
- Average LTV,
- and Order Count
These customer segmentation reports allow teams to prioritize development, support, and marketing resources towards the roles that contribute most significantly to growth and profitability.
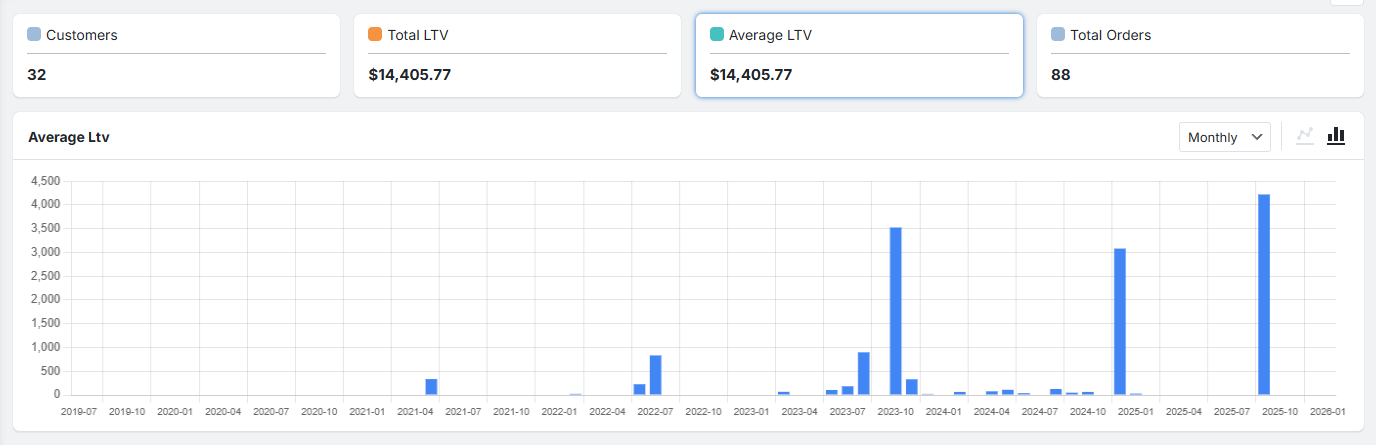
Customer segmentation reports by location
This report breaks down the customer base by geographic location, such as city, state, or country, which is important for:
- recognizing market penetration,
- identifying high-potential or underperforming regions,
- and planning logistical or marketing expansions.
These insights can help store managers run regional campaigns and design localized, targeted campaigns.
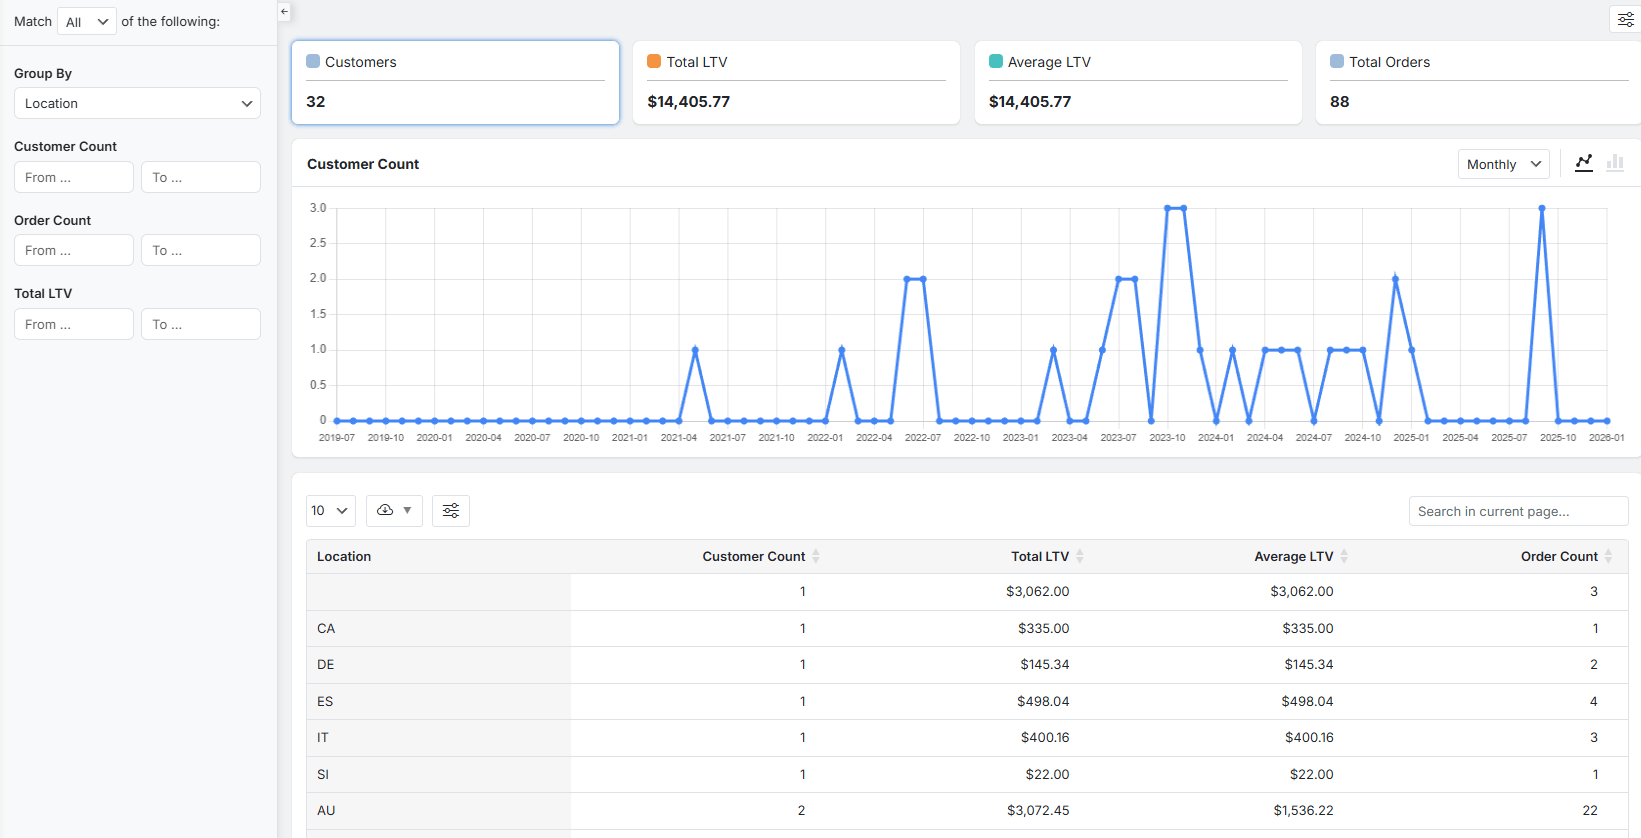
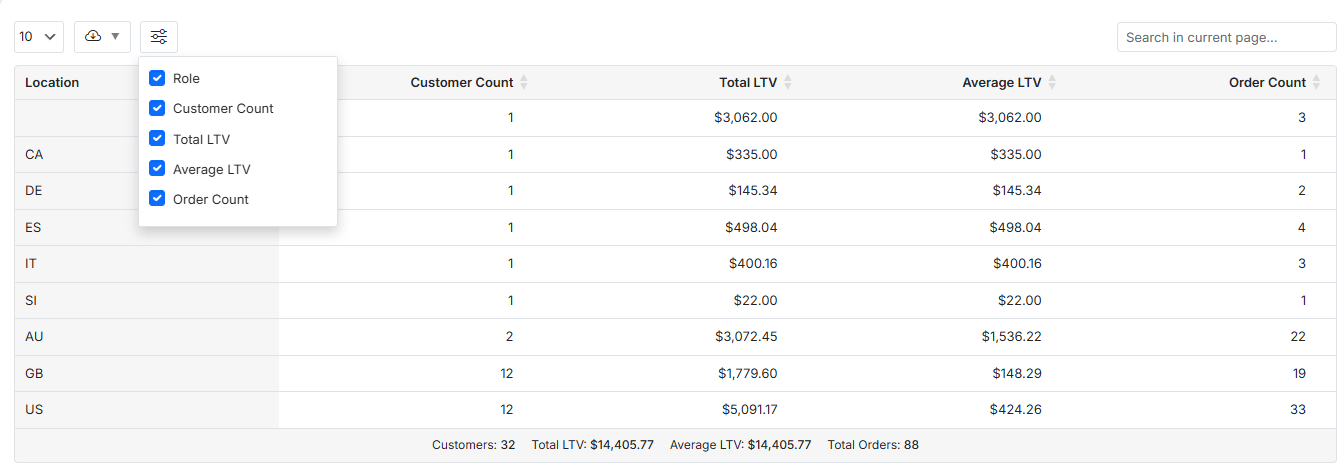
Advanced Data Points for Segmentation
The key metrics you need to focus on for each location are:
- Customer Count,
- Total LTV,
- Average LTV,
- and Order Count
Analyzing sales performance by region can help you to recognize:
- Valuable market: A high customer count and strong Total LTV,
- Premium market opportunity: A promising high Average LTV despite a smaller customer base,
- Price-sensitive area: high customer count but low Average LTV
Using reports for customer segmentation by location is the key to making data-driven decisions on where to focus sales efforts and allocate advertising budgets.
REPORTiT – Advanced WooCommerce Reporting
The Easy Way to Segment Customers and Boost Loyalty in WooCommerce
Step-by-Step Guide: Using Reports to Segment Your Customers
Here is a detailed, step-by-step guide on how to use the REPORTiT plugin to generate customer segmentation reports.
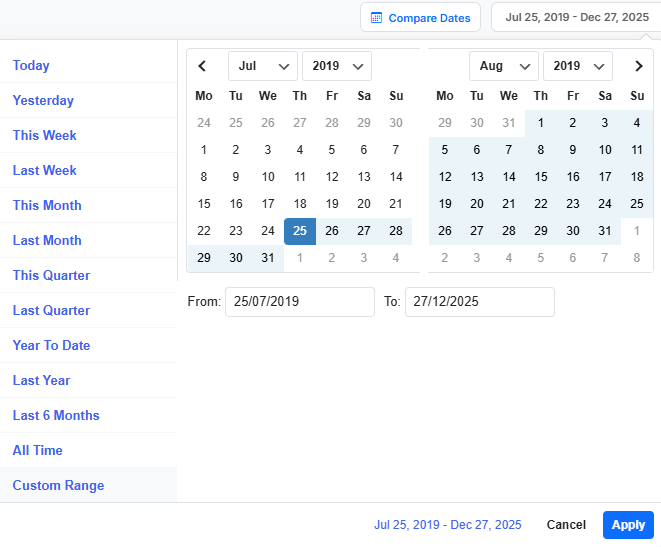
Step 1: Define Your Date Range
The first step to generate a meaningful report is specifying the period you wish to analyze. In the plugin, you can choose one of the convenient presets like “Last 30 Days,” “This Quarter,” or “Last Year” for quick insights or set a custom date range for more precise analysis.
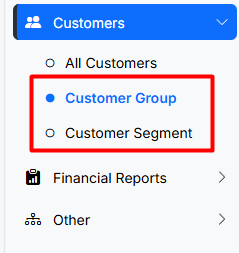
Step 2: Navigate to the Customer Segment Report
In the plugin menu, navigate to Customer > Customer Segment/ Customer group. These sales reports are specifically designed to filter, dissect, and analyze your customer purchase or behavior.
They collect customer data from orders, user profiles, and browsing behavior and turn it into a single, powerful interface.
Step 3: Filter by Popular Segmentation Models: Demographic, Behavioral, Psychographic, and Geographic
After choosing the right report, it is time to set filters that map directly to the four primary segmentation models. You can apply these filters individually or in combination to create highly specific groups:
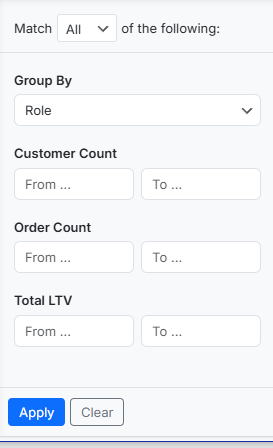
Demographic & Geographic: Use the Group by filter to list the data based on Location (Country, State/City), or User Role.
Customer count: To define “the number of Customers”.
Order Count: To identify “Frequent Shoppers” (e.g., more than 3 orders).
Total LTV: To specify the most valuable segments.
Click “Apply” to generate your custom customer segmentation report.
Step 4: Creating Actionable Segments: Turning Reports into Target Audiences
Once filtered, the report dashboard presents the segment data in three clear, interactive sections, allowing you to validate and act on your insights.
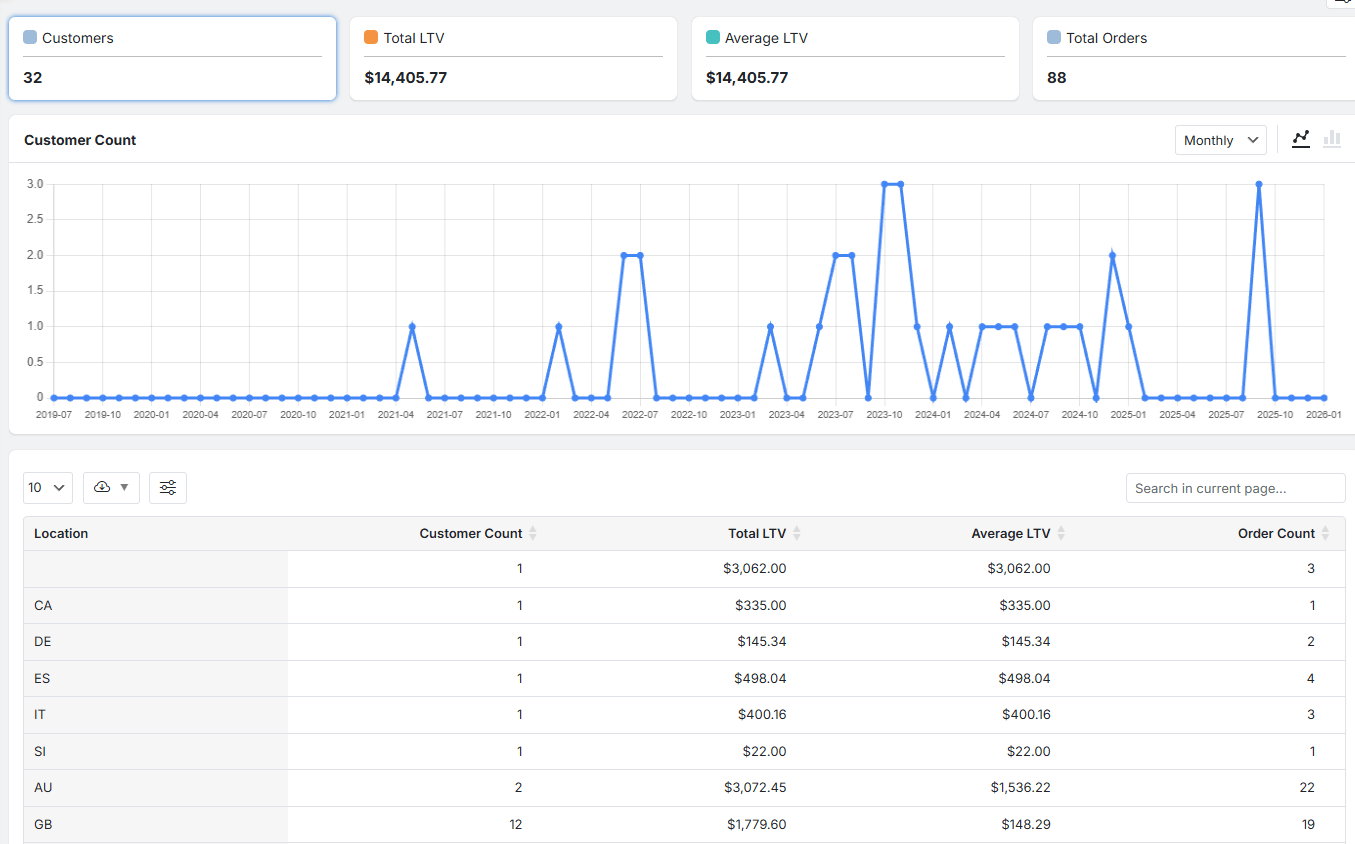
Summary Cards
At the top, you’ll have access to key metric cards (e.g., Total Customers in Segment, Total Revenue, Average Order Value).
These provide an instant, high-level performance snapshot of the defined segment.
Interactive Charts
Clicking on any summary card typically reveals a visual chart below. This dual-view (switch between line and bar chart) helps you to easily track the segment performance.
It is also possible to adjust the time frame and see if the trend is growing or shrinking Weekly, monthly or yearly.
Detailed & Customizable Data Table:
The table report below the chart includes columns like Customer Name, Email, Order Count, Total Spend, and Last Order Date.
These data in the customer segmentation reports are highly customizable. You can:
- show/hide columns,
- sort by any field (e.g., sort by Total Spend to see the top customers first),
- and export the visible data to CSV or Excel.
Case Study: Maximizing ROI with Data-Driven Campaigns
| Brand / Case | Campaign Type | Result (ROI or Outcome) | Source |
|---|---|---|---|
| Wondercide | Segmented retention + direct mail / digital | 600% ROI overall, segment ROIs: 310%, 203%, 155% | Lexer customer segmentation case studies (lexer.io) |
| Mountain Khakis | Segmented holiday campaign | Improved sales via real-time CDP insights (not exact % but measurable ROI increase) | Lexer customer segmentation case studies (lexer.io) |
| Stio (Outdoor Apparel) | Data-driven targeted marketing | Higher ROI and improved cost efficiency through precise targeting | Stio case study Page2Response (Path2Response) |
Best Practices for Generating Insights from Reports
Start with a Hypothesis: Generate customer segmentation reports to answer a specific question like “Are customers from City X more valuable?” Or “Who are the most valuable customers to send a special offer to this week?”
Combine Data Points: Use multiple filters to narrow down the results exactly based on what you need. For example, don’t just segment by location; segment by location and purchase behavior.
Segment Continuously: Customer behavior can change over time. Regularly update your segments to keep your targeted campaigns and promotions relevant.
Validate with Tests: Use A/B testing to see if your segmented campaigns actually perform better than your generic ones.
Common Mistakes to Avoid in Customer Segmentation and Reporting
Creating Too Many Segments: If you divide customers into many segments with a small group of customers in each segment, it doesn’t make sense to spend time and money to focus on.
Relying on Outdated Data: Using old reports means you’re marketing to who your customers were, not who they are. Use fresh data.
Ignoring Small but Important Segments: A small group of ultra-high-value customers is often more important than a large group of occasional buyers.
Not Integrating Systems: Your customer segmentation reports are useless if you can’t easily export the lists to your email or ad tools. Ensure your tech stack works together.
Setting and Forgetting: Markets and customers evolve. Your segmentation strategy should be a recurring task, not a one-time project.
Measuring Success: KPIs and Metrics for Targeted Campaigns
To prove the value of using reports for customer segmentation, you must track the right Key Performance Indicators (KPIs) for your targeted campaigns. Compare these metrics against your non-segmented, broadcast campaigns.
| KPI | What It Measures | Why It Matters for Segmented Campaigns |
|---|---|---|
| Open Rate & Click-Through Rate (CTR) | Engagement with your message. | Segmented campaigns should see significantly higher rates, indicating better relevance. |
| Conversion Rate | Percentage of recipients who complete the desired action (e.g., make a purchase). | This is the ultimate test of relevance and effectiveness. |
| Average Order Value (AOV) | The average amount spent per order. | Targeted upsell/cross-sell campaigns should lift the AOV for that segment. |
| Return on Ad Spend (ROAS) | Revenue generated for every dollar spent on advertising. | Precise targeting should lead to a more efficient use of ad budget. |
| Customer Lifetime Value (LTV) by Segment | The total value a customer from a specific segment brings over time. | Helps identify which segments are most profitable to nurture long-term. |
Future Trends: AI, Machine Learning, and Predictive Segmentation Reports
The future of customer segmentation reports is predictive and automated. Artificial Intelligence (AI) and Machine Learning (ML) are moving beyond descriptive analytics (“what happened”) to predictive (“what will happen”) and prescriptive (“what should we do”) insights. Future tools will automatically analyze thousands of data points to:
- Predict Churn: Identify customers who are likely to stop buying before they do, allowing for proactive retention campaigns.
- Predict Lifetime Value: Forecast the future value of a new customer soon after their first purchase, guiding acquisition spend.
- Discover Hidden Segments: Uncover non-obvious customer groupings that humans might miss, revealing new opportunities.
- Automate Campaign Triggers: Instantly launch a personalized email or offer when a customer’s behavior matches a predictive pattern (e.g., browsing a product category three times in a week).
Embracing these trends will take using reports for customer segmentation from a reactive tactic to a proactive business intelligence engine.
REPORTiT – Advanced WooCommerce Reporting
The Easy Way to Segment Customers and Boost Loyalty in WooCommerce
Conclusion: Leveraging Reports for Effective, Targeted Campaigns
Using WooCommerce reports for customer segmentation is not merely an analytical exercise; it is the fundamental process for understanding your customers and building meaningful relationships with them.
By systematically creating customer segmentation reports, you gain the clarity needed to move from noisy, generic marketing to focused, respectful, and highly effective communication.
FAQs
Q: What is customer segmentation and why is it important?
A: Customer segmentation is the process of dividing a customer base into distinct groups based on specific characteristics, such as behavior, demographics, or needs. It enables businesses to tailor marketing efforts and improve campaign effectiveness.
Q: How do reports enhance the accuracy of customer segmentation?
A: Reports provide data-driven insights that help identify trends, preferences, and customer behaviors, ensuring segments are backed by real metrics rather than assumptions.
Q: Which types of reports are most valuable for targeted campaigns?
A: Behavioral reports, demographic analysis, purchase history, engagement metrics, and channel interaction reports are vital for crafting targeted campaigns.
Q: Can small businesses use segmentation reports effectively?
A: Yes, small businesses can leverage affordable reporting tools and platforms to segment their audience, personalize outreach, and enhance marketing ROI.
Q: What are the key metrics to track for campaign success after segmentation?
A: Key metrics include conversion rates, engagement levels, customer lifetime value, retention rates, and segment-specific campaign performance.”


