


Are you looking for a solution to transform a frustrated customer into a loyal brand advocate? The best way is to utilize customer service reports and drive data to inform strategies that increase customer satisfaction and retention.
In this guide, we aim to show you how to identify specific pain points for improving customer service using data analysis of customer service reports.
What Are Customer Service Reports? Definitions and Types
WooCommerce Customer service reports are analytical summaries that provide very important data like customer behavior, feedback, and transactional data for store managers to help them take necessary actions. Unlike generic sales reports, Customer service reports are specifically designed to evaluate and improve the customer experience throughout their journey. They answer critical questions about satisfaction, loyalty, and operational efficiency.
The primary types of reports you should focus on include:
Customer Report
The customer report provides a basic overview of individual customer profiles and their long-term value.
For improving customer service with data in this report, you can look at the important metrics such as customers’ names, email, total number of orders, item count, last purchase date, total spend, Average Order Value (AOV), and classification (e.g., New Customers, Returning Customers).
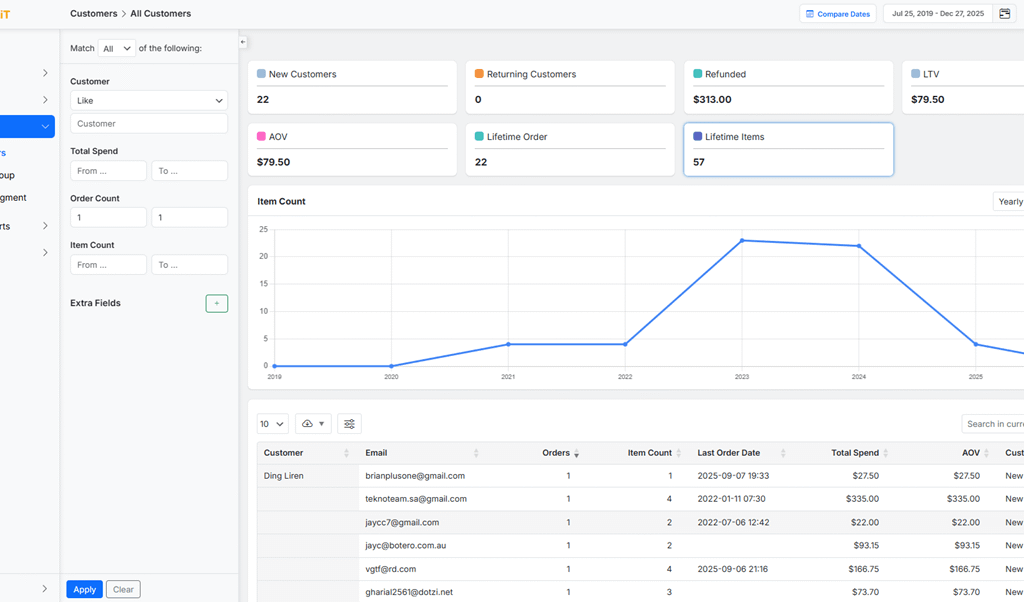
The most critical metric here is the Customer Lifetime Value (LTV). It shows the total revenue a business can expect from a single customer account, which is crucial for identifying its most valuable customers (high LTV).
By understanding your loyal and valuable customers, you can prioritize issue resolution for key accounts and design retention strategies that directly improve customer service and satisfaction.
Order History & Behavior Reports
Order report provides essential metrics to analyze transactional behavior of customers over time, like order count, frequency, total and net sales, refund rates, and average items per order.
Tracking these data, like products purchased, and the marketing source (Attribution) for each transaction in a timeline format, helps store managers to make informed decisions for improving customer service.
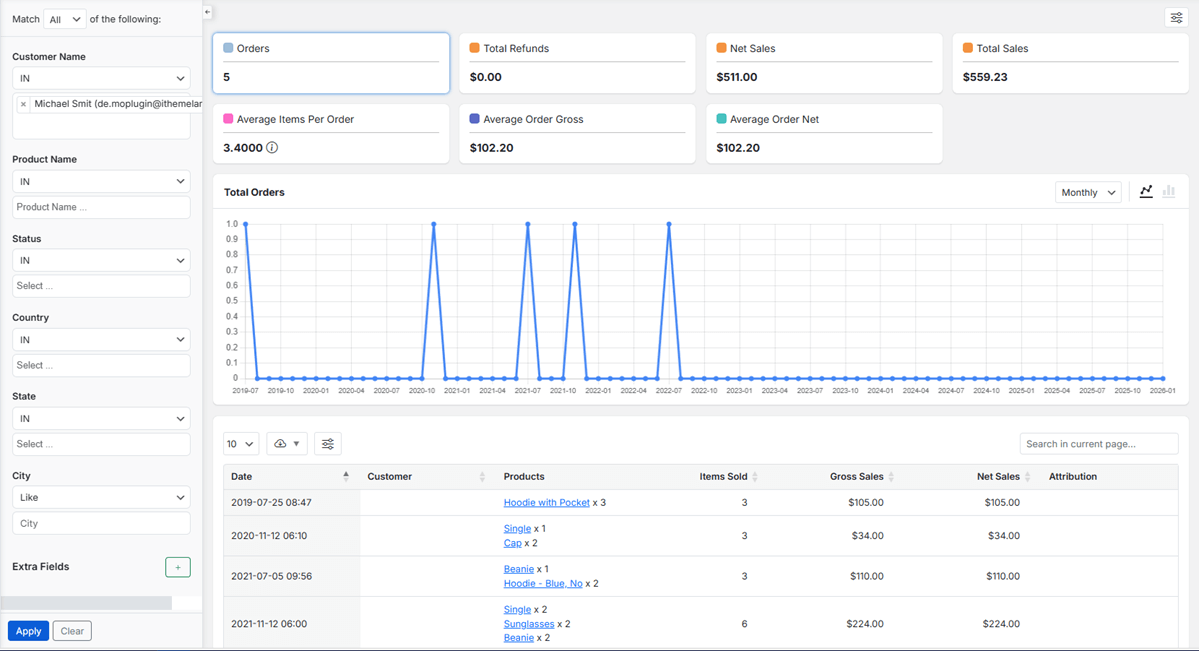
By examining purchase frequency and gaps in order history, support teams can identify at-risk customers who haven’t purchased recently and may need re-engagement.
For instance, examining a customer’s AOV and product preferences allows managers to offer more relevant and effective upsell or cross-sell recommendations during support interactions.
Furthermore, analyzing refund patterns can pinpoint systemic product issues or delivery problems that are causing dissatisfaction.
Customer Segment Report
Segmentation is one of the most powerful Customer service reports, which is useful for categorizing your entire customer base into actionable groups.
Based on the criteria you have set in the settings, the plugin automatically segments users into types such as VIPs, Single-Order Customers, Repeat Customers, At-Risk, and Lost Customers, summarizing the count, total orders, revenue, AOV, and LTV for each segment.
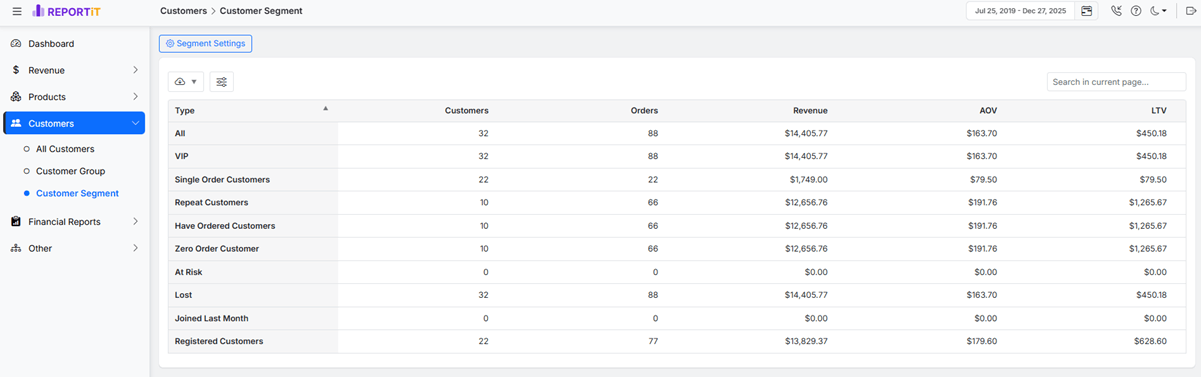
For customer service strategy, this is a game-changer. For instance, you can create a targeted email campaign offering special support to “At-Risk” customers or design a win-back program for the “Lost” segment.
This report ensures that efforts to improve customer service with data are efficient and targeted, allowing you to allocate resources where they will have the greatest impact on retention and satisfaction.
Attribution Reports
Attribution Reports connect customer acquisition and sales performance directly to your marketing efforts. By recognizing the most attractive channels or campaigns (e.g., organic search, a specific Facebook ad, an email newsletter) for generating orders, you can answer to important questions like “Where are our customers coming from, and what are their expectations?”.
Tracking the order count, total paid amount, refunds, and net sales attributed to each source is also helpful for understanding the Customer expectations and offering services that exactly meet their requirements.
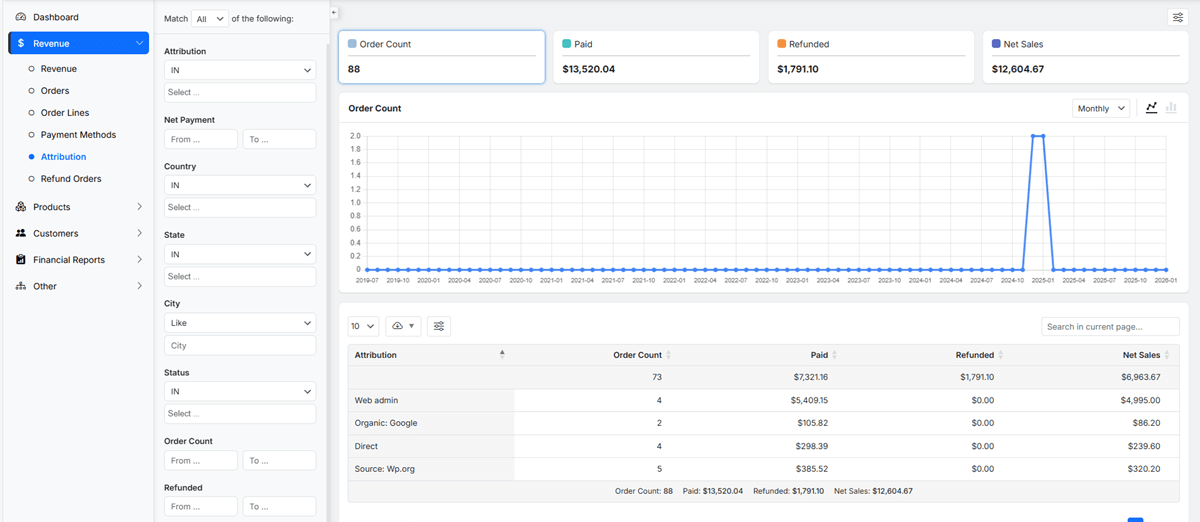
For example, if a high-value channel has a disproportionately high refund rate, it signals a mismatch between marketing promise and product reality that needs urgent attention.
By using reports to improve customer service, you can align your support messaging and quality with the brand promise of each acquisition channel, ensuring a consistent and satisfying customer journey from first click to post-purchase support.
Recommended Tools and Software for Customer Service Reporting
While WooCommerce offers basic customer data, to gain deep, actionable insights for improving customer service with data, store managers need more advanced tools. For a comprehensive, all-in-one solution that keeps your data private and integrated, the REPORTiT – Advanced Reporting for WooCommerce is the best top-tier choice.
This modular, add-on-based architecture report plugin is designed as a complete reporting suite that operates 100% on your server.
You can use its fabulous features to generate incredibly detailed and customizable customer service reports.
In order to achieve deep segmentation, the plugin provides filtering options by purchase history, user role, geographic location, and lifetime value in the customer service reports with a few clicks.
Furthermore, its ability to schedule automated email reports means key customer service KPIs can be delivered directly to managers or support teams, ensuring everyone is aligned with data-driven goals.
REPORTiT – Advanced WooCommerce Reporting
The easy way to boost customer satisfaction and loyalty with WooCommerce service reports
Gathering Data: Sources for Effective Customer Service Reporting
To start collecting the right data, you need to install and activate the REPORTiT plugin.
After activation, navigate to WordPress Dashboard > iThemeland > REPORTiT
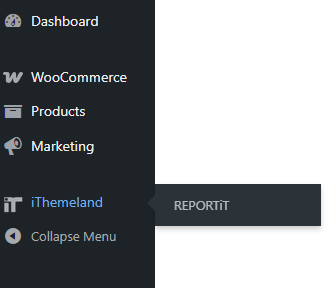
The plugin automatically pulls all necessary information directly from your WooCommerce database—including order histories, customer metadata, and billing details—and displays them in different visual, structured reports like Customer Group, Customer Segmentation, Order Reports, and more.
This seamless integration eliminates manual data compilation, ensuring the insights you work with are both accurate and up-to-date.

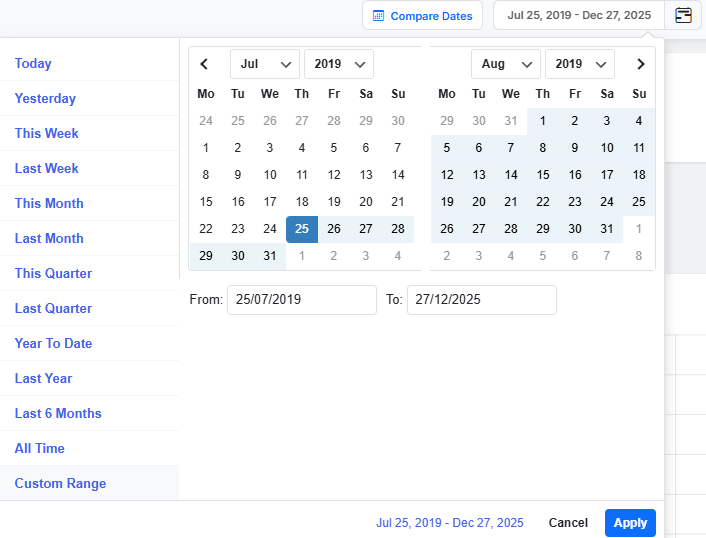
The plugin also allows you to isolate data from a specific timeframe, such as the last 30 days, the previous quarter, or set a custom date range using a built-in calendar. This is crucial for customer service analysis because it lets you correlate support trends with business events.
Filter Customer Service Reports
Once your core customer service report is generated, you can use the following filters to drill down into the report for improving customer service with data.
Here are some important filters for building custom customer service reports:
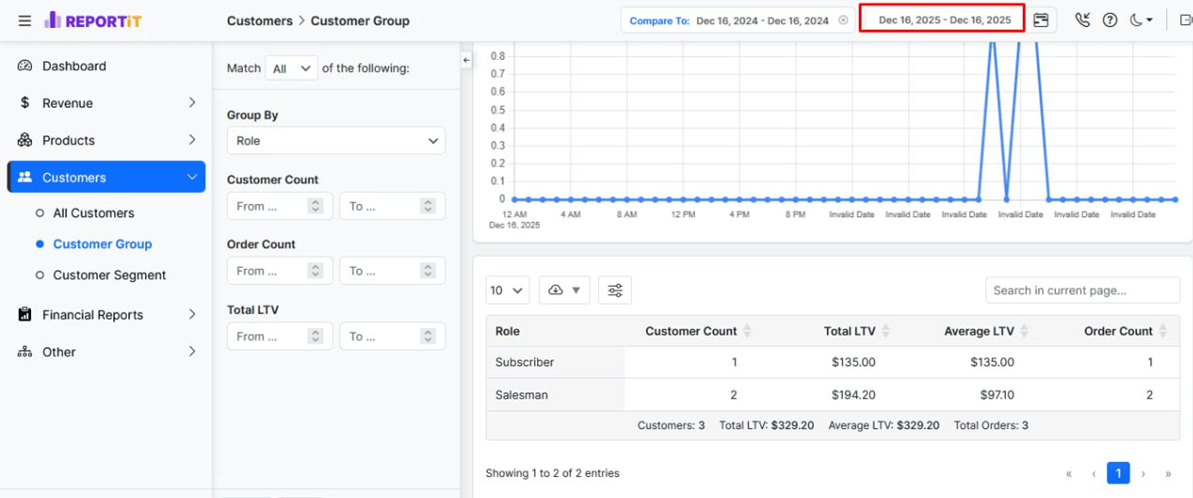
Filter Customer Group by user role
Filtering Customer Group by Role is the most powerful tool for offering personalized service. This filter enables you to tailor your analysis and subsequent actions to the needs of specific customer types.
You can check if “Retailers” has a high satisfaction rate or if the “Wholesaler” group shows a pattern of unresolved complaints.
By focusing on one group at a time, you can develop precise services based on your customer behavior and value.
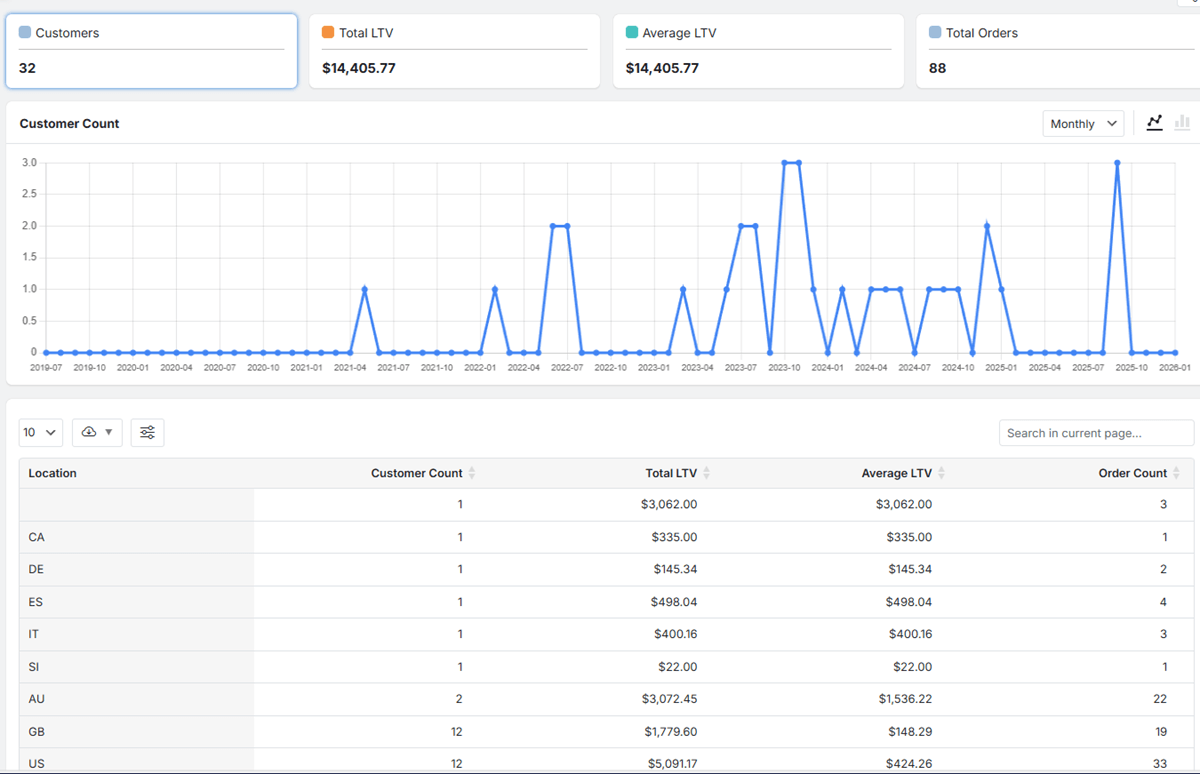
Filter Customer Group by Location
Filtering Customer Service Reports by geographic criteria, typically country, state, or city, is essential for identifying region-specific service challenges or opportunities.
You may discover that customers in a particular area have a higher refund rate, possibly indicating issues with shipping carriers, climatic effects on products, or cultural fit.
Alternatively, you might recognize a region with exceptionally high customer lifetime value (LTV), which means there is an opportunity to double down on your sales by localized marketing or community-building support.
Improving customer service with data from these geographic patterns allows you to adapt your policies, or communication strategies to better meet localized needs.
Key Metrics Tracked in Customer Service Reports
To effectively use Customer service reports, you need to focus on the right key performance indicators (KPIs):
| Metric | What It Measures | Why It Matters for Customer Service |
|---|---|---|
| Customer Lifetime Value (LTV) | Total net profit attributed to a customer over their entire relationship. | Identifies high-value customers for VIP treatment, loyalty rewards, and personalized support. |
| Average Order Value (AOV) | The average amount spent each time a customer places an order. | Helps design support and upsell strategies; a declining AOV may signal customer dissatisfaction. |
| Purchase Frequency | How often a customer buys from your store within a set period. | Highlights loyal customers and can alert you to at-risk customers who haven’t purchased recently. |
| Product Return Rate | The percentage of purchased items that are returned. | A high rate for a specific product indicates potential quality issues, misleading descriptions, or sizing problems that need to be addressed. |
| Customer Segmentation | Groups customers based on behavior, demographics, or value. | Enables personalized communication and targeted support, making customers feel understood. |
How to Analyze Customer Service Reports
To analyze customer service reports effectively, start by looking for correlations. The goal is to find a trend and explore “why” it is happening.
Let’s see how.
Identifying Trends and Pain Points from Reports
The true power of analysis is spotting trends before they become critical issues. Look for a systematic trend or patterns in customer service reports, such as:
- A seasonal spike in ordering specific products (indicating a need for better shipping communication)
- A cluster of negative reviews for a new product. (revealing a need for supplies from another brand)
By identifying these trends, you can proactively address the root cause—whether it’s improving product information, streamlining the checkout process, or enhancing post-purchase updates—thereby preventing future customer frustration and reducing support workload.
Best Practices for Creating and Using Reports to Enhance Customer Experience
To maximize the impact of improving customer service with data, follow these best practices:
- Define Clear Objectives: Before creating a customer service report, specify the question you want to answer (e.g., “Why are new customers not returning to make a second purchase?”).
- Schedule Regular Reviews: Automate sending reports to your (or your team) Email to regularly analyze operational metrics and strategic trends.
- Share Insights Across Teams: Customer service data shouldn’t live in isolation. Share findings with marketing (for better targeting), product development (for quality fixes), and management (for strategic decisions).
- Pay attention to Feedback: Use insights to make a change, then measure the impact in subsequent reports. Did simplifying a return policy reduce related support tickets?
Common Mistakes to Avoid When Using Reports
Common Mistakes in analyzing customer service reports can lead to poor decisions:
- Analysis Paralysis: Getting lost in too much data, which can make you confused about taking the correct action.
- Ignoring Context: Taking a metric like a dip in AOV at face value without considering external factors like a major sale or economic changes.
- Data Silos: Failing to connect customer service data with sales or inventory reports results in missing the bigger picture.
REPORTiT – Advanced WooCommerce Reporting
The easy way to boost customer satisfaction and loyalty with WooCommerce service reports
Conclusion: Leveraging Reporting for Continuous Customer Service Excellence
Using reports to improve customer service is only effective when committing to a cycle of continuous learning and adaptation. By moving from intuition to evidence-based decision-making, you empower your team to not only solve problems but to anticipate needs and elevate the entire customer experience.
The strategic analysis of customer service reports transforms your support from a cost center into a powerful engine for driving satisfaction, loyalty, and sustainable business growth.
FAQ
Q: What types of reports are most useful for improving customer service?
A: Commonly useful reports include ticket resolution time, customer satisfaction scores, first contact resolution rates, and root cause analysis reports, all of which provide actionable insights to enhance customer service.
Q: How often should customer service reports be reviewed?
A: Reports should be reviewed regularly—generally weekly or monthly—to identify trends promptly and make timely improvements.
Q: What is the best way to share customer service report findings with your team?
A: Share insights through team meetings, dashboards, or regular email digests, focusing on actionable data and areas requiring immediate attention.
Q: How can small businesses utilize reports without expensive software?
A: Small businesses can use built-in reporting features of basic CRM systems, spreadsheets, or free analytics tools to gather and analyze customer service data effectively.
Q: How do customer service reports contribute to a better customer experience?
A: Reports help identify service gaps, understand customer needs, and track performance, enabling businesses to streamline processes and elevate the overall customer experience.”


