


Advanced reports in WooCommerce provide powerful insights that help you identify best-performing products and worst-performing products, allowing you to optimize inventory, marketing strategies, and revenue growth.
The WooCommerce Report plugin offers comprehensive product performance analytics, enabling store owners to track sales trends, customer preferences, and profitability with precision. By leveraging these detailed reports, you can focus on promoting high-demand items, improving underperforming products, and ultimately enhancing your store’s success.
Let’s review how transforming raw data into actionable insights can help you maximize profits and streamline your business operations efficiently.
What is Advanced Reports for product performance analytics?
Advanced reports are in-depth analytical tools that provide detailed insights into various aspects of your WooCommerce store’s performance. Unlike basic sales reports, advanced product performance analytics enable you to track key metrics, including revenue, profit margins, conversion rates, and customer behavior.
With advanced reports, store owners can:
- Identify best-performing products – Discover top-selling items with high revenue, strong conversion rates, and customer demand.
- Identify worst-performing products – Recognize underperforming products with low sales, high return rates, or poor customer feedback.
- Analyze trends over time to optimize pricing, promotions, and inventory management.
- Segment data by categories, customer demographics, or periods for precise decision-making.
By leveraging these insights, businesses can make data-driven decisions to boost profitability, improve marketing strategies, and enhance overall store performance.
Importance of Product Performance Analytics in Business
- Data-Driven Decision Making: By tracking precise metrics, such as sales conversions and customer behavior, merchants can identify the best-performing products to focus on and the worst-performing to improve or phase out. This data-backed approach leads to smarter investments and higher profitability.
- Improved Inventory & Supply Chain Management: Product performance analytics help businesses maintain optimal stock levels by highlighting fast-moving and stagnant items. This prevents costly overstocking of slow sellers while ensuring high-demand products remain available, streamlining operations and reducing waste.
- Enhanced Marketing & Promotions: With insights into top revenue-generating products, businesses can design targeted campaigns for maximum impact. Meanwhile, underperforming items can be revitalized through strategic discounts, bundling, or better product positioning to boost sales.
- Increased Customer Satisfaction & Retention: Analyzing purchase trends ensures businesses stock products customers actually want, improving satisfaction. Removing or upgrading poorly rated items also minimizes returns and negative feedback, fostering long-term loyalty.
- Competitive Advantage: Real-time product performance analytics enable quick adaptation to market shifts. Stores leveraging these insights can adjust pricing, promotions, and inventory faster than competitors, securing a stronger market position.
Difference Between Basic and Advanced Reports
When managing a WooCommerce store, understanding your sales and product performance is crucial. While basic reports provide simple overviews of your store’s activity, advanced reports offer deeper insights with customizable analytics. The key difference lies in the level of detail, segmentation, and actionable data they provide. Below is a comparison table highlighting the main distinctions:
| Feature | Basic Reports | Advanced Reports |
|---|---|---|
| Data Depth | General sales totals, basic trends | Granular insights (e.g., by product, category, customer segment) |
| Customization | Limited filters, fixed formats | Highly customizable (date ranges, metrics, comparisons) |
| Product Performance | Shows top sellers in simple lists | Identifies best/worst performers with profit margins, conversion rates |
| Customer Insights | Basic order counts | Behavioral analytics (repeat purchases, customer lifetime value) |
| Inventory Analysis | Basic stock level alerts | Predictive analytics for demand forecasting |
| Marketing ROI | No campaign-specific tracking | Measures promotion effectiveness (discounts, bundles) |
| Export & Integration | Simple CSV exports | API integrations, scheduled reports, visual dashboards |
Key Metrics in Advanced Reports for Product Performance Analytics
Below are the most important metrics to monitor in your advanced reports for a complete understanding of your product performanc.
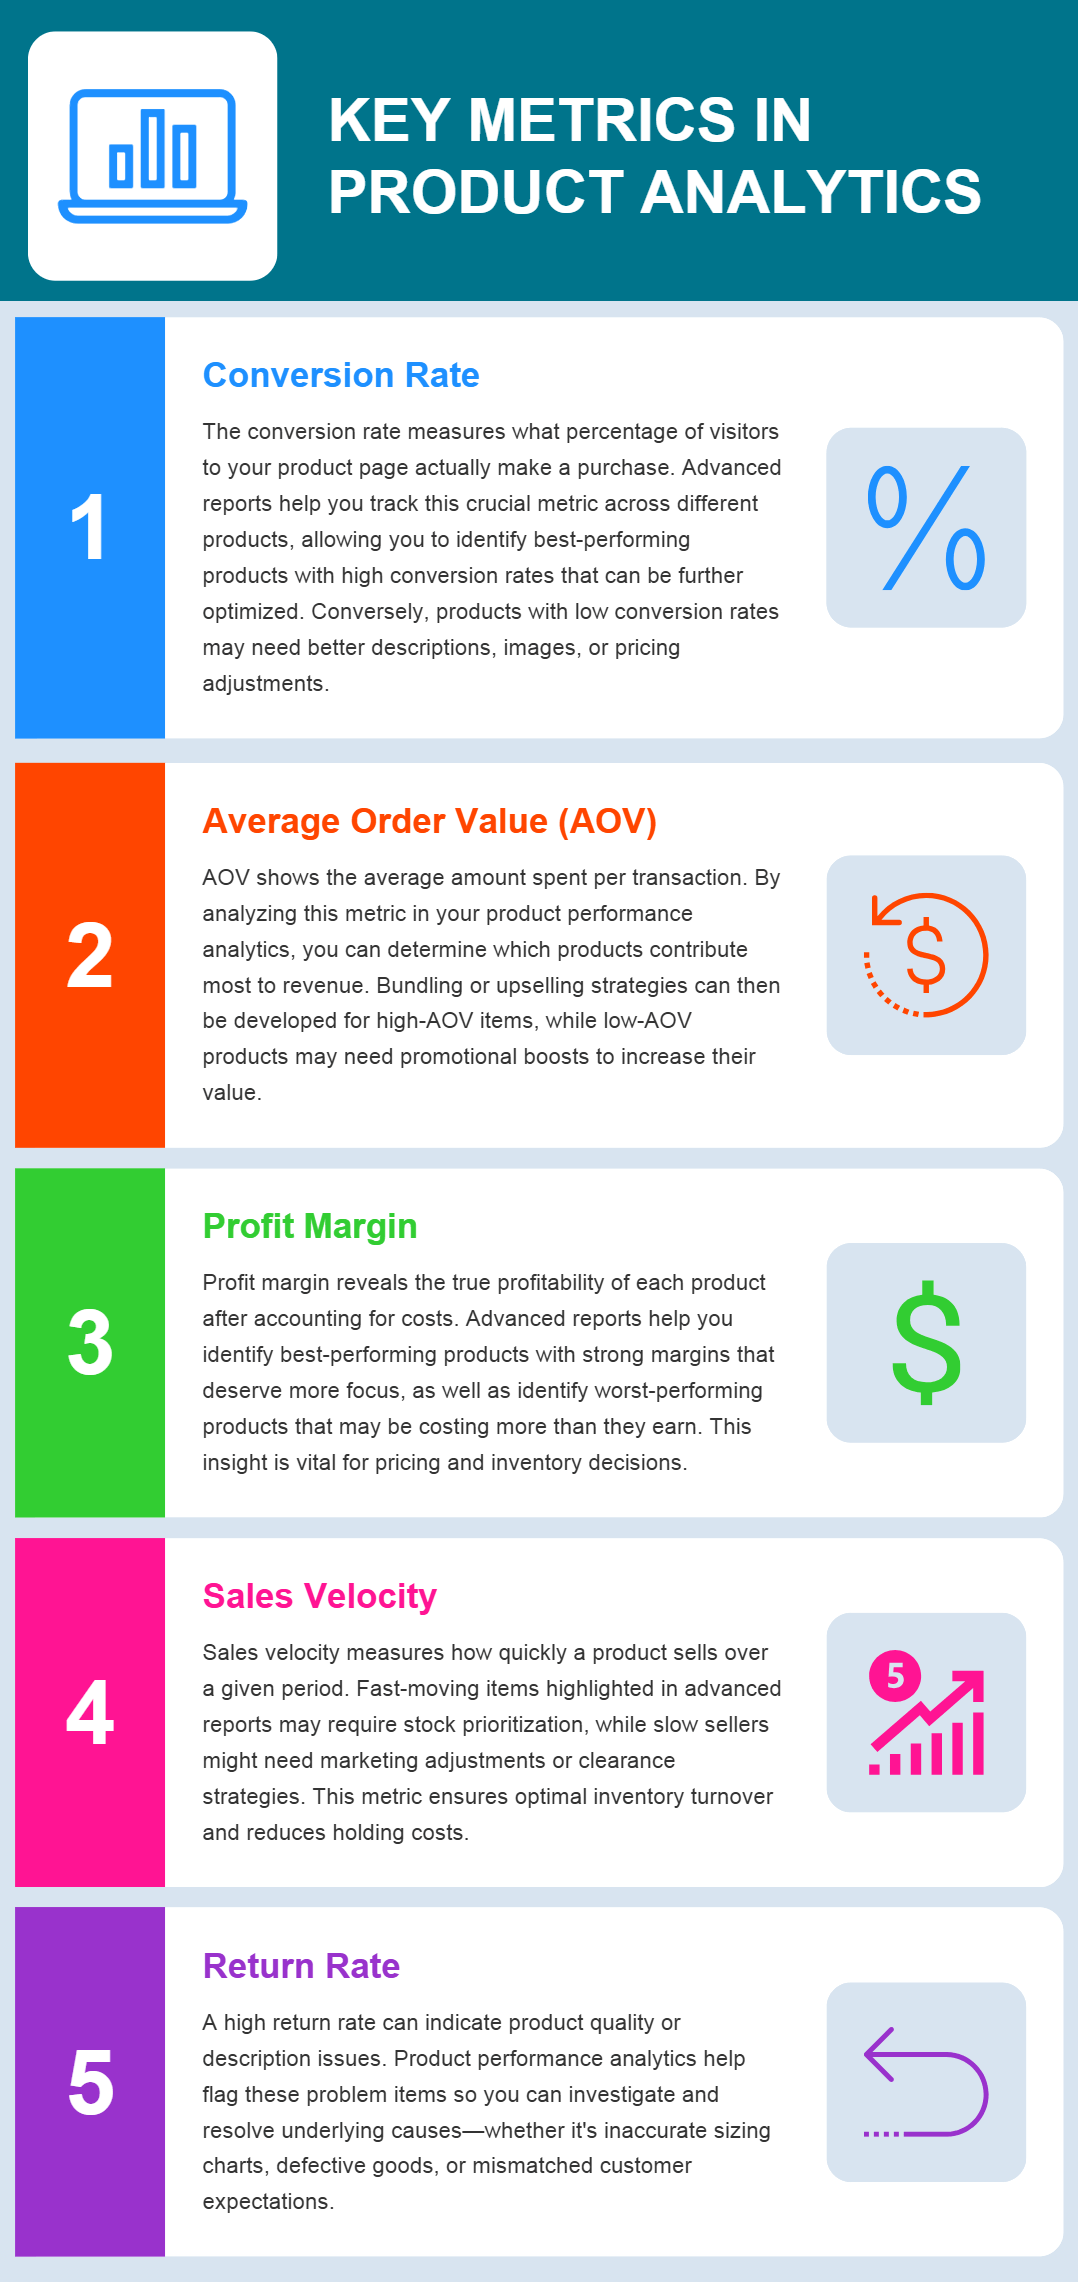
1. Conversion Rate
The conversion rate measures what percentage of visitors to your product page actually make a purchase. Advanced reports help you track this crucial metric across different products, allowing you to identify best-performing products with high conversion rates that can be further optimized. Conversely, products with low conversion rates may need better descriptions, images, or pricing adjustments.
2. Average Order Value (AOV)
AOV shows the average amount spent per transaction. By analyzing this metric in your product performance analytics, you can determine which products contribute most to revenue. Bundling or upselling strategies can then be developed for high-AOV items, while low-AOV products may need promotional boosts to increase their value.
3. Profit Margin
Profit margin reveals the true profitability of each product after accounting for costs. Advanced reports help you identify best-performing products with strong margins that deserve more focus, as well as identify worst-performing products that may be costing more than they earn. This insight is vital for pricing and inventory decisions.
4. Sales Velocity
Sales velocity measures how quickly a product sells over a given period. Fast-moving items highlighted in advanced reports may require stock prioritization, while slow sellers might need marketing adjustments or clearance strategies. This metric ensures optimal inventory turnover and reduces holding costs.
5. Return Rate
A high return rate can indicate product quality or description issues. Product performance analytics help flag these problem items so you can investigate and resolve underlying causes—whether it’s inaccurate sizing charts, defective goods, or mismatched customer expectations.
Customizing Advanced Reports in Popular Tools
Below, we’ll break down how to use effective tools to identify best-performing products, pinpoint underperforming items, and improve overall business strategies.
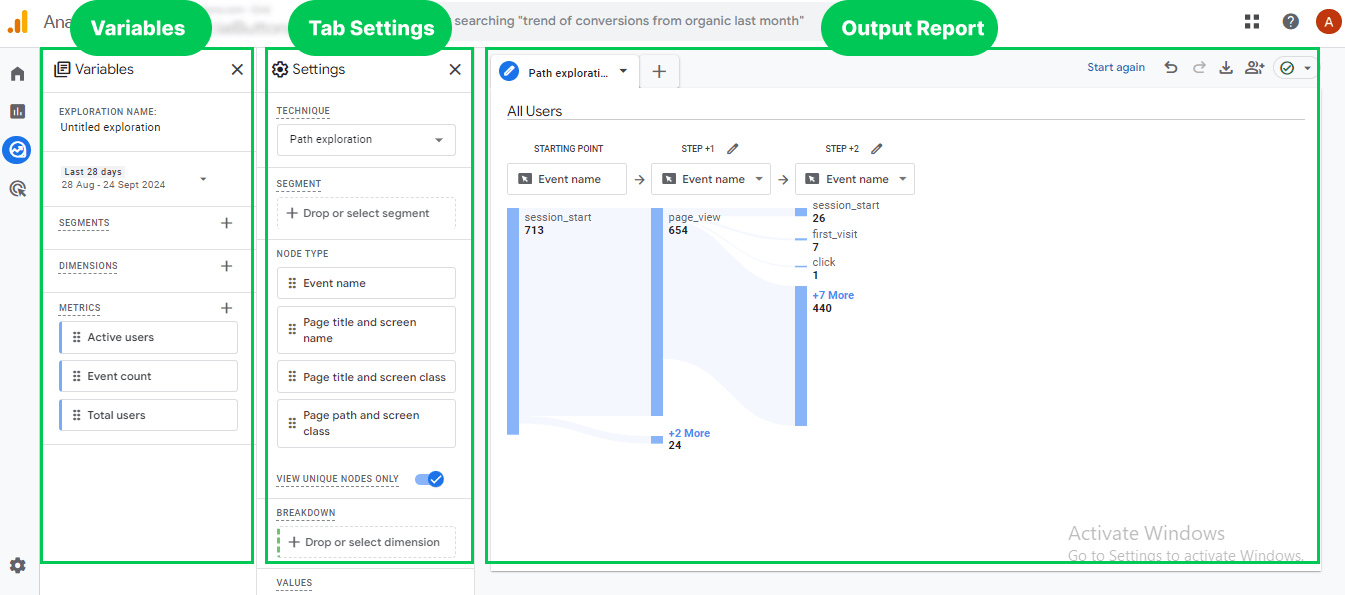
Customizing Advanced Reports in Google Analytics 4 (GA4)
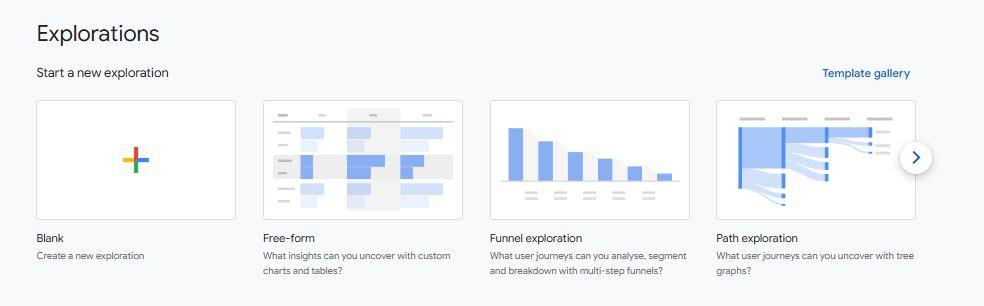
GA4 offers Explorations, a flexible reporting feature that allows deep customization.
Key Features:
- Free-Form Exploration – Build tables, bar charts, and heatmaps with custom dimensions/metrics.
- Funnel Exploration – Track user drop-offs in conversion paths.
- Path Exploration – Analyze how users navigate through your site.
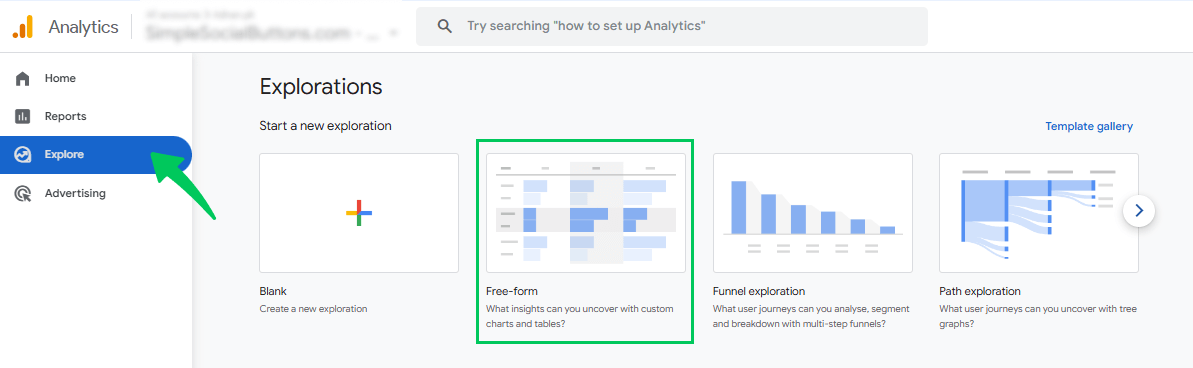
How to Create a Custom Report in GA4:
Navigate to “Explore” → Select “Free Form Exploration.”
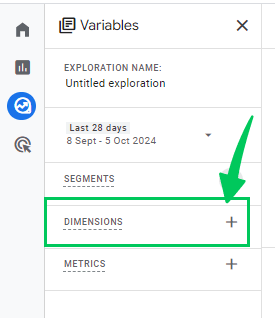
Set Variables – Choose date range, segments, dimensions (e.g., “Product Name”), and metrics (e.g., “Revenue”).
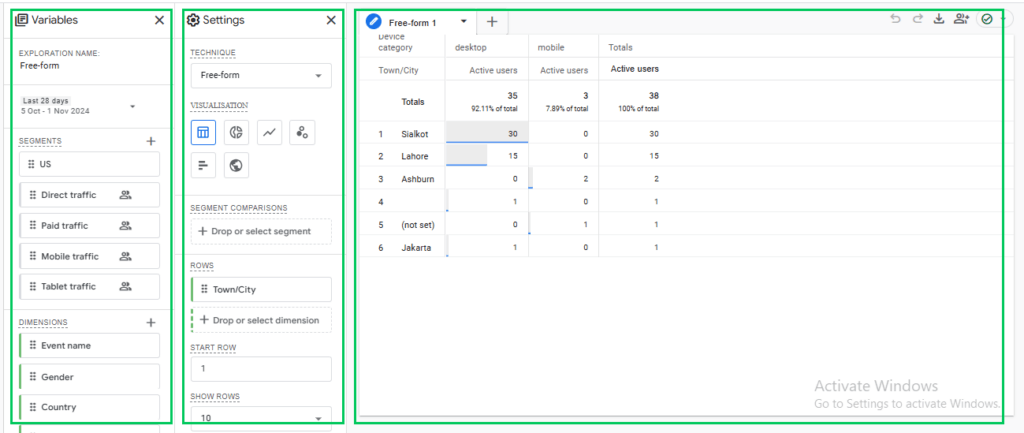
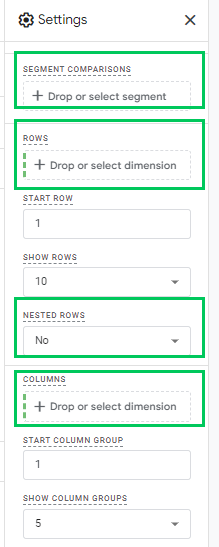
Configure Tab Settings – Drag dimensions to rows, metrics to values, and apply filters – Read more here.
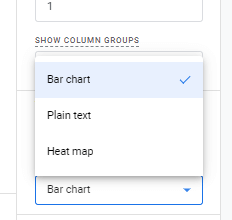
Visualize Data – Use tables, bar charts, or heatmaps for analysis.
Save & Share – Export as PDF or share with stakeholders.
Pro Tip: Use segments to compare high vs. low-performing products.
Creating Advanced Reports in Power BI
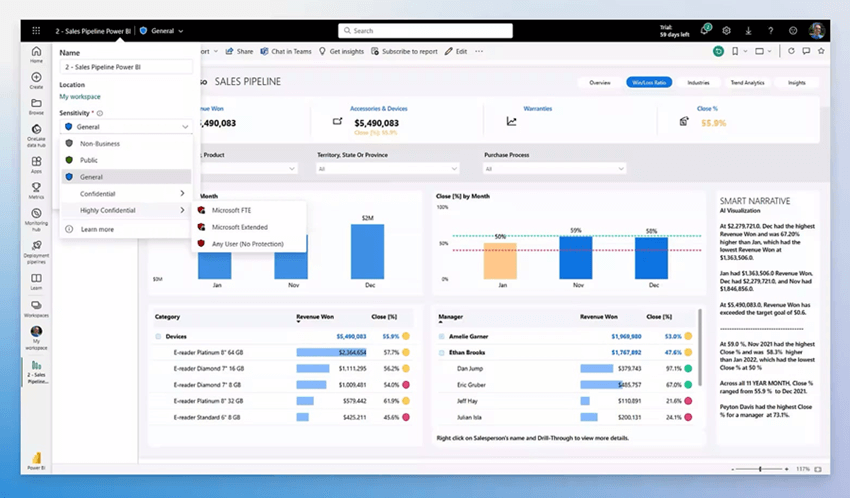
Power BI is ideal for businesses needing interactive dashboards with real-time data.
Key Features:
- Drag-and-Drop Customization – Build reports without coding.
- DAX Formulas – Create calculated metrics (e.g., profit margins).
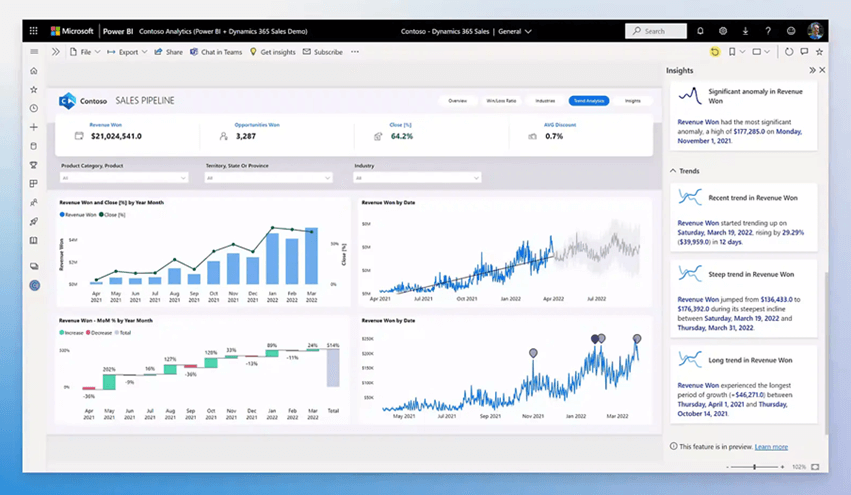
- AI-Powered Insights – Automatically detect trends.
How to Build a Custom Report in Power BI:
Import Data – Connect to Excel, SQL, or GA4.

Design Visuals – Use tables, line charts, or maps.
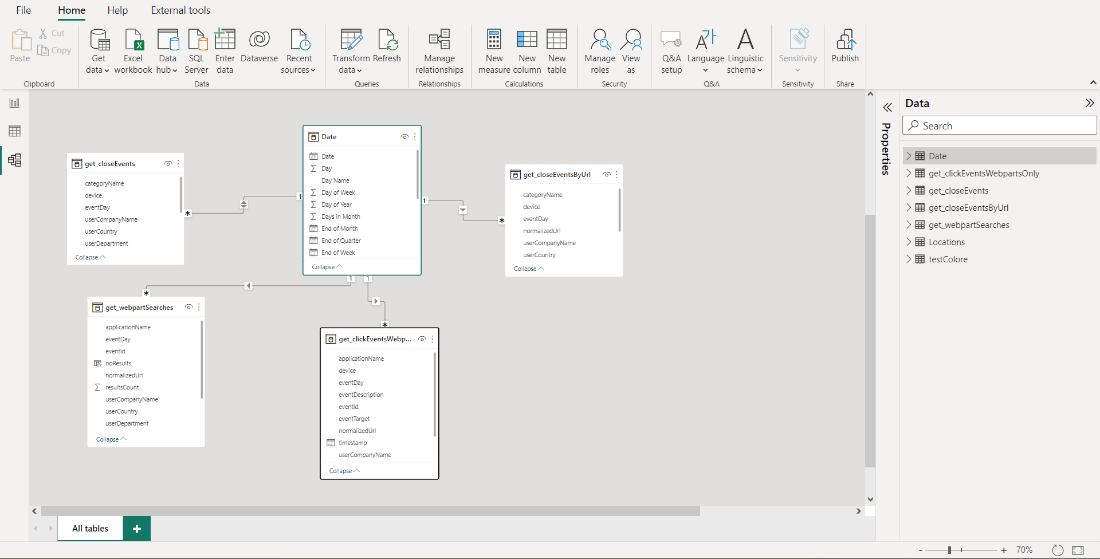
Apply Filters – Segment by product, region, or time.
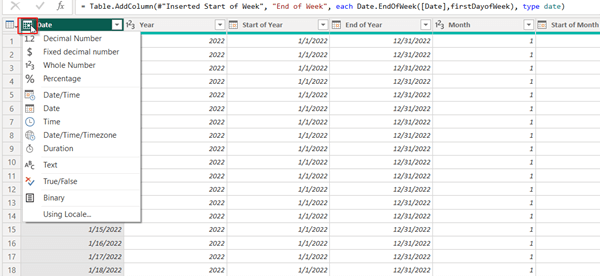
Create Measures – Use DAX for metrics like:
text
Profit Margin = DIVIDE([Profit], [Revenue], 0)
Publish & Share – Deploy to Power BI Service for team access.
Pro Tip: Use drill-through filters to analyze product performance by category.
3. WooCommerce Report plugin
This plugin helps e-commerce stores track sales, product performance, and inventory efficiently.
Key Features:
- Generating Best/Worst-Selling Products with one click – Identify top revenue generators and low performers.
- Customer Behavior Tracking – See purchase frequency and repeat purchase.
- Custom Date Range Filters – Compare performance over time.
How to Use the WooCommerce Reports plugin?
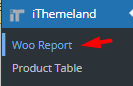
Install and activate the plugin, then navigate to WordPress Dashboard> iThemeland> Woo Reports.
Select Report Type – On the main page, you can find a list of more than 50 predefined reports that can be generated with one click.
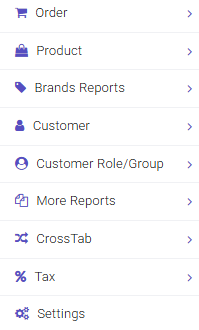
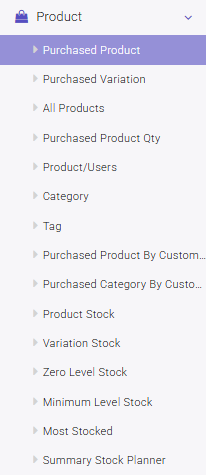
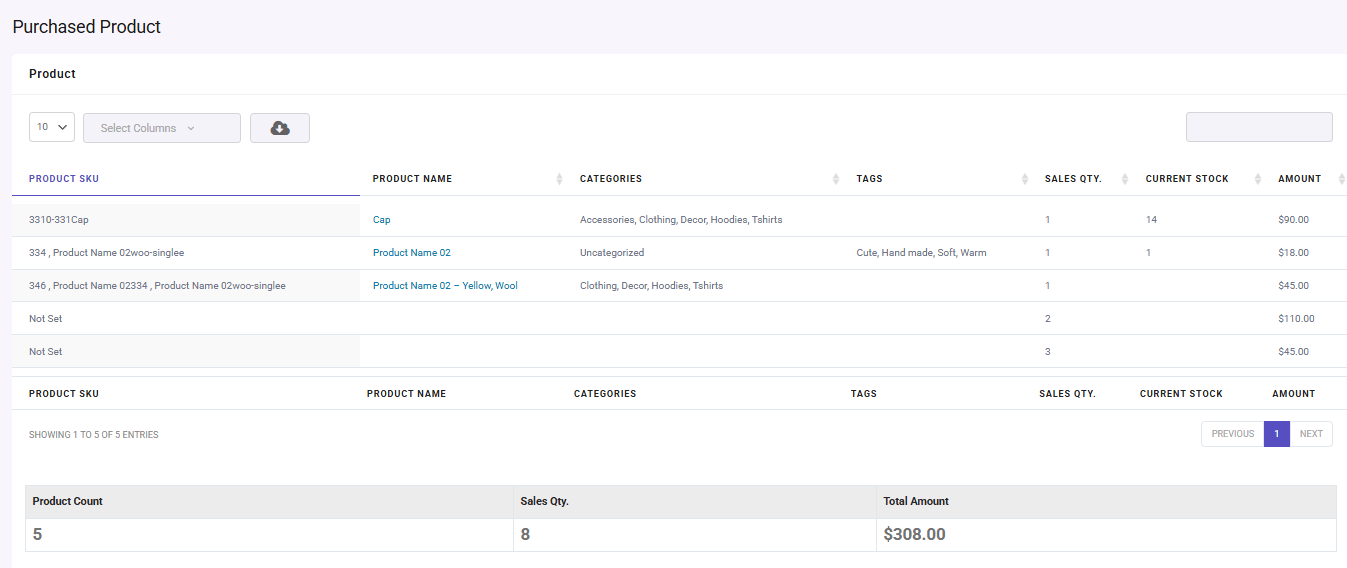
To identify best performing products (or identify worst performing products), you just need to open the Product menu. and click on the Purchased Product report.
Set Date – in the report page, click on the Search button and set Date from and Date to using the built-in calendar.
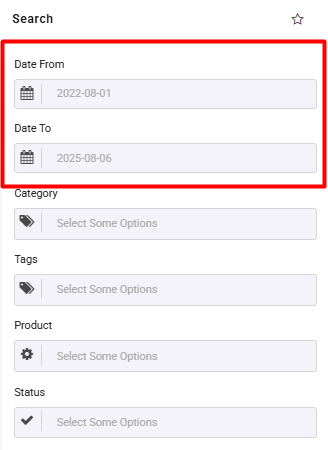
Apply Filters – In the Search form, you can also limit the data in the report by Category, Tags, Order Status, or Specific Products.
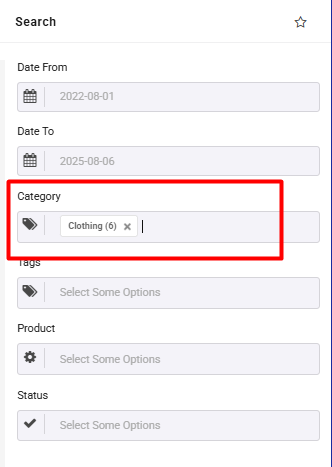
For example, we set a date range and filter the Clothing category to analyze the best and worst-selling products in this category:
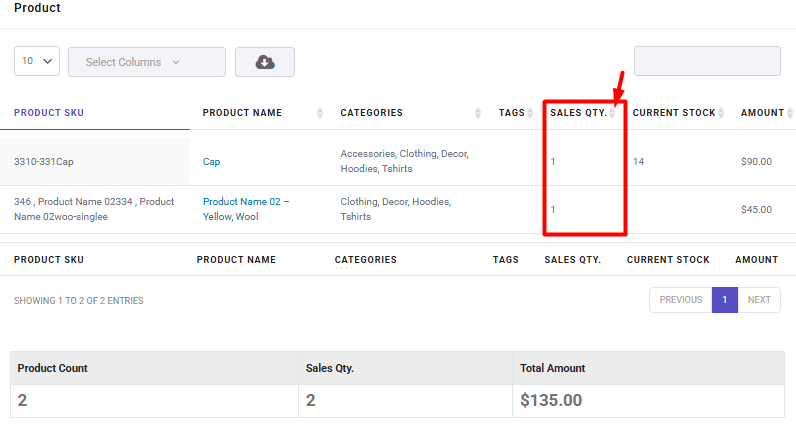
By sorting the Sales Qty in the report, we recognized the Cap as the best performing product and Wool as the worst performing product in the Clothing category.
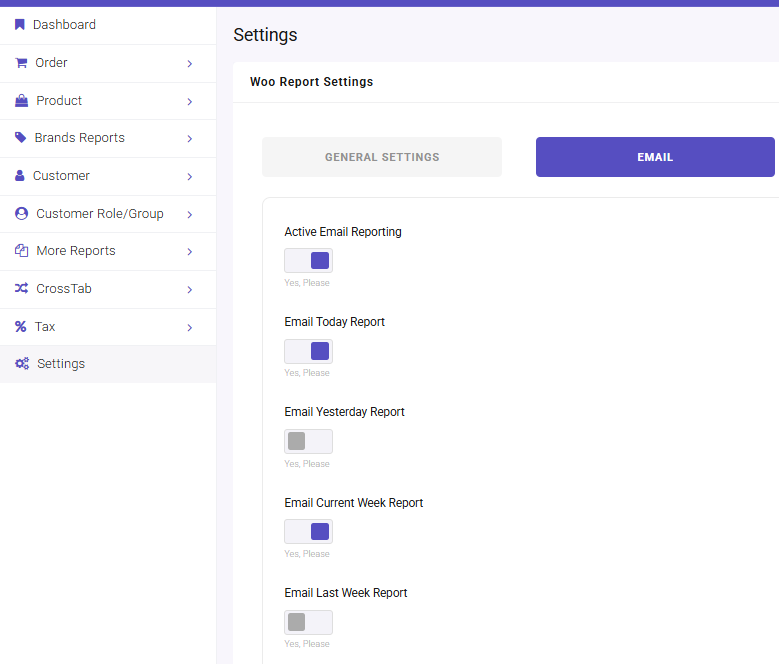
Schedule receiving report – In the WooCommerce report plugin, you can schedule and receive sales reports for custom time periods by going to Settings and enabling Active Email reporting.
In this tab, select your desired date range (daily, weekly, monthly, or custom) to view sales analytics.
Read More: Send automated sales report email in WooCommerce?(2 practical methods)
REPORTiT – Advanced WooCommerce Reporting
The easy way to turn product data into profit-driving insights in WooCommerce
Benefits of Advanced Reports to Identify Best-Performing Products
Let’s explore the key benefits of using advanced reports to analyze and improve your product portfolio:
1. Data-Driven Inventory Decisions
Advanced reports provide real-time visibility into which products are selling quickly and which are stagnating. By analyzing sales velocity and stock turnover rates, businesses can optimize their inventory levels – increasing orders for top sellers while reducing overstock of underperformers. This prevents capital from being tied up in slow-moving inventory while ensuring popular items remain available.
2. Precision Marketing Allocation
With product performance analytics, marketers can identify exactly which products generate the highest ROI. Resources can then be focused on promoting these best-performing products through targeted ads, email campaigns, and homepage placements. Conversely, underperforming items can be repositioned with special offers or bundled with popular products to improve their visibility.
3. Improved Profit Margins
Advanced reports break down profitability by product, factoring in costs, discounts, and shipping expenses. This allows businesses to:
- Increase prices on high-demand items with strong margins
- Discontinue or renegotiate supply costs for worst-performing products
- Create strategic bundles to move low-margin inventory
4. Enhanced Customer Experience
By tracking metrics like return rates and customer reviews through product performance analytics, businesses can:
- Quickly address quality issues with problematic products
- Highlight top-rated items in marketing materials
- Improve product descriptions and images for underperformers
This leads to higher satisfaction, better reviews, and increased customer lifetime value.
5. Competitive Market Adaptation
Advanced reports provide trend analysis that helps businesses:
- Spot emerging bestsellers before competitors
- Identify declining products early
- Adjust pricing strategies in real-time
This agility is crucial in fast-moving e-commerce markets where consumer preferences change rapidly.
6. Strategic Product Development
Historical product performance analytics reveal:
- Which features or Variations customers prefer
- Seasonal demand patterns for different products
- Price sensitivity across product categories
Case Study: Applying Advanced Reports to Analyze Product Performance
Using the powerful WooCommerce Report plugin, we’ll demonstrate practical applications for identifying both high-potential products and underperformers that may be draining resources.
The following sections showcase real-world scenarios where advanced reports provide actionable insights:
Using Advanced Reports to Identify Worst-Performing Products
Challenge: Many stores struggle with products that tie up capital but generate minimal sales.
Solution: Generate purchased product quantity with the WooCommerce Reports plugin:
- Navigate to Products > Purchased Product Qty
- Set the Date range in the Search form.
- Press the Search button to generate the report.
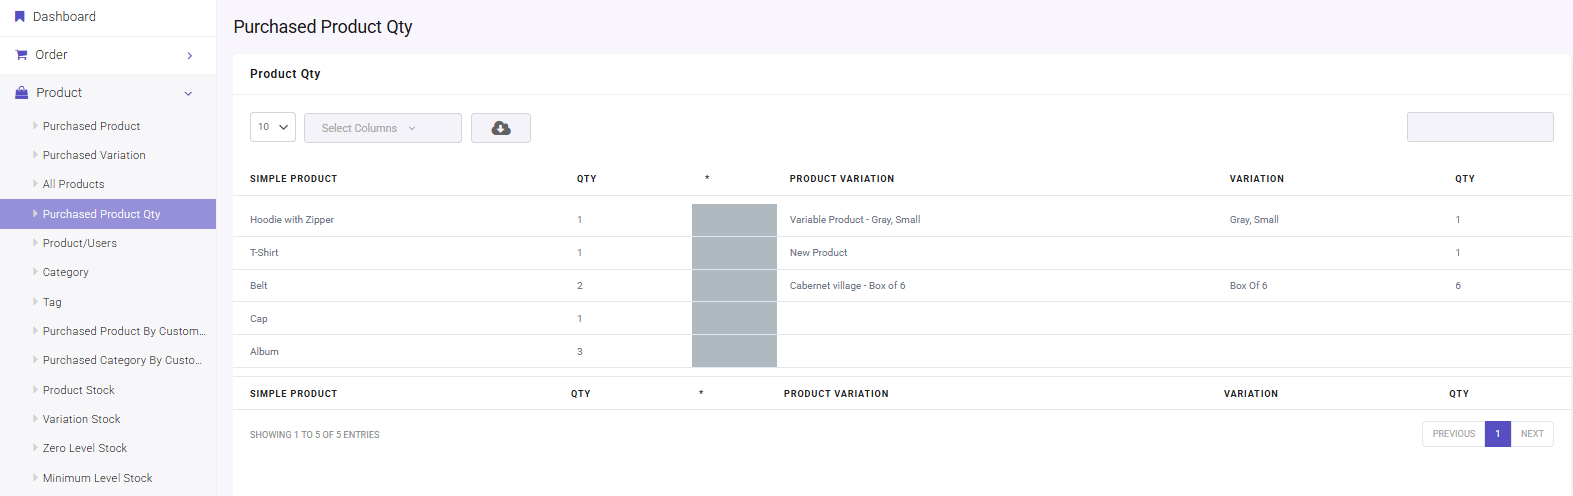
- Look at the QTY data to recognize which products had the lowest sales quantity.
Customer Behavior Analysis Through Product Performance Analytics
Challenge: Understanding which products are ordered more by customers.
Solution: Generates purchased products by customer with the WooCommerce report plugin:
- Access the Product menu and choose the Purchased Product by Customer report.
- Open the Search form and set the Date range.
- Press the Search button to get the report.
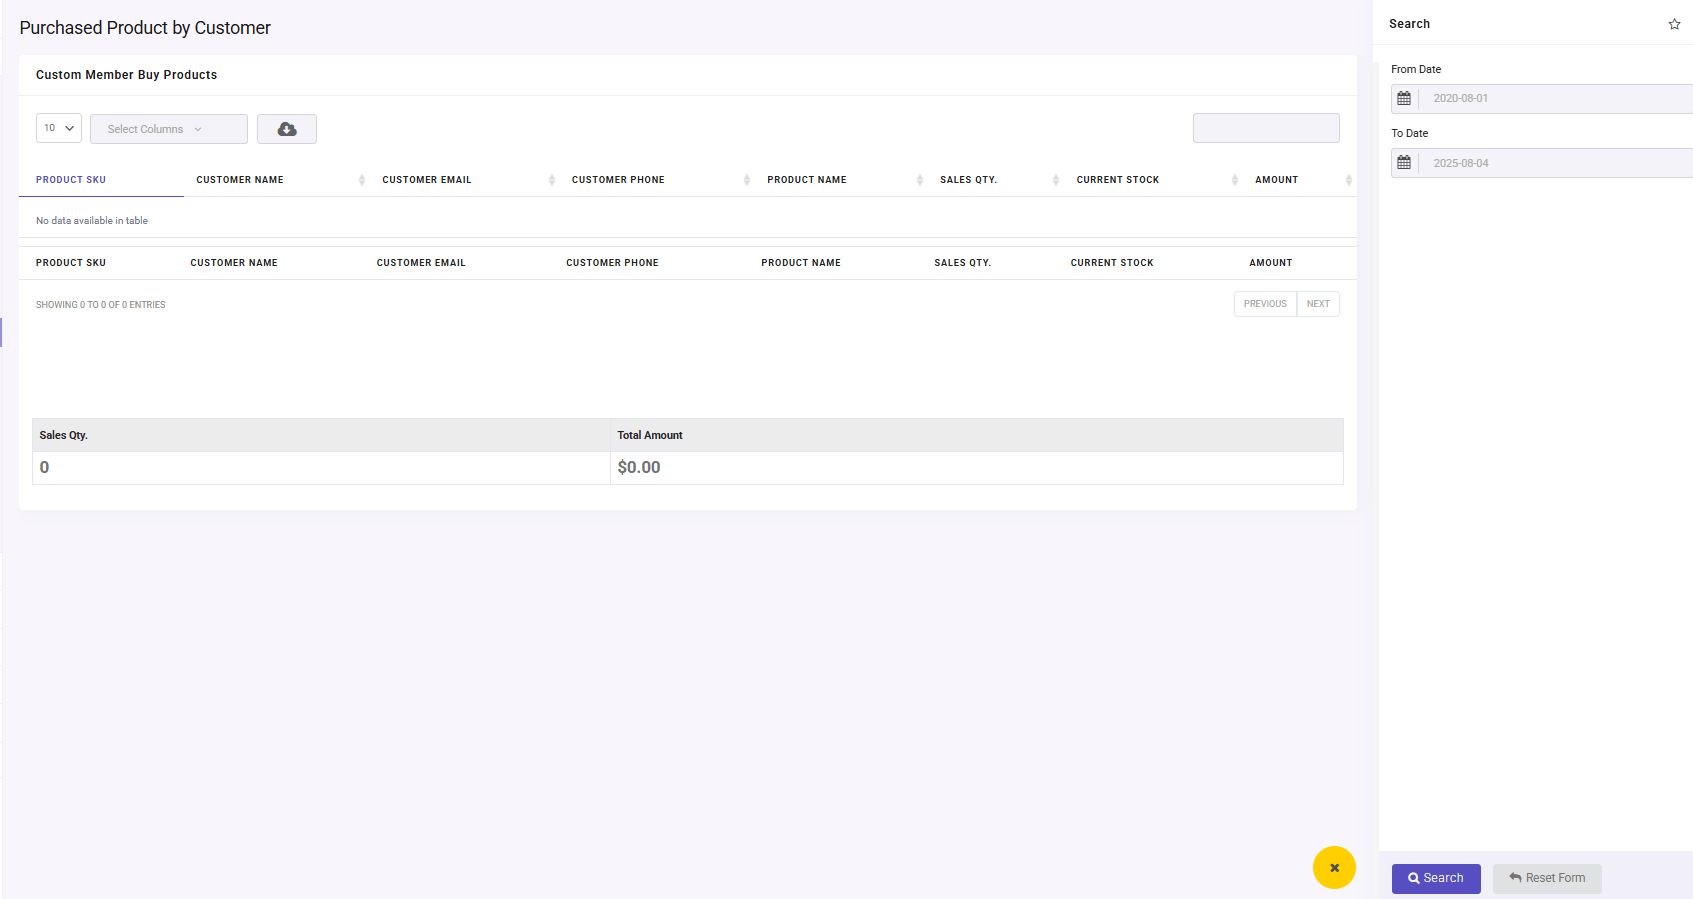
- Analyze the sales quantity of products and identify the preferred products by each customer.
Advanced Reports for Data-Driven Decision Making
With the WooCommerce Reports plugin, you can generate highly specific analytics to identify best-performing products, spot underperformers, and optimize your entire sales strategy.
Here’s a breakdown of key report types and how they enhance product performance analytics:
1. Purchased Product Report
Tracks which products sell the most, helping you identify best-performing products and allocate marketing resources effectively.
Read more: 3 practical ways to get product sales report in WooCommerce?
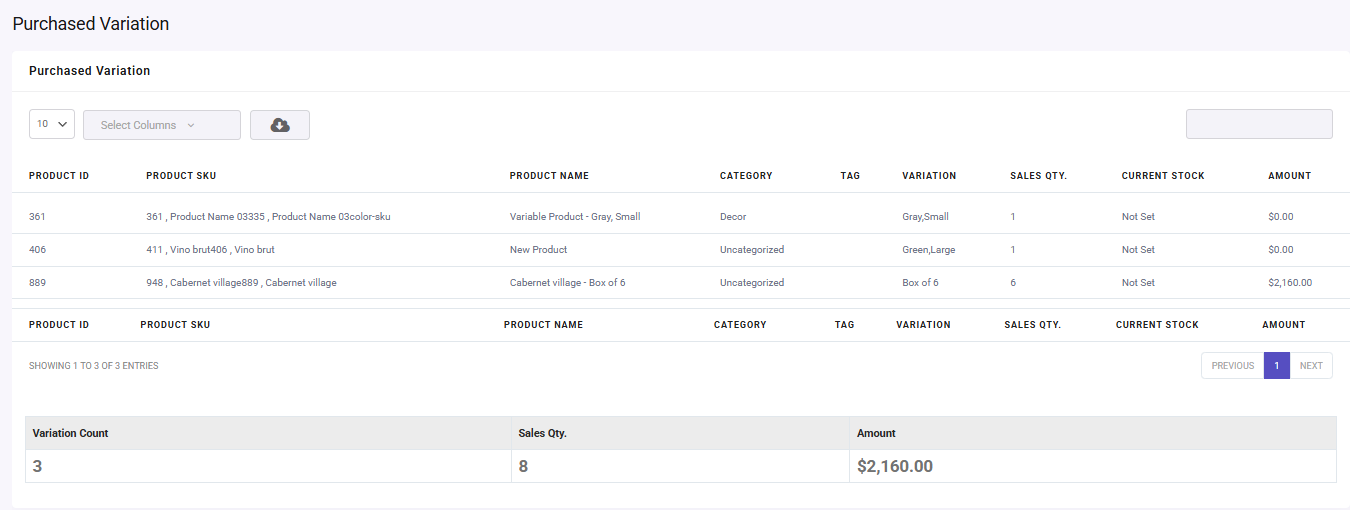
2. Purchased Variation Report
Reveals which product variations (colors, sizes, etc.) are most popular, enabling better inventory planning.
Read more: How to get product variation reports in WooCommerce?
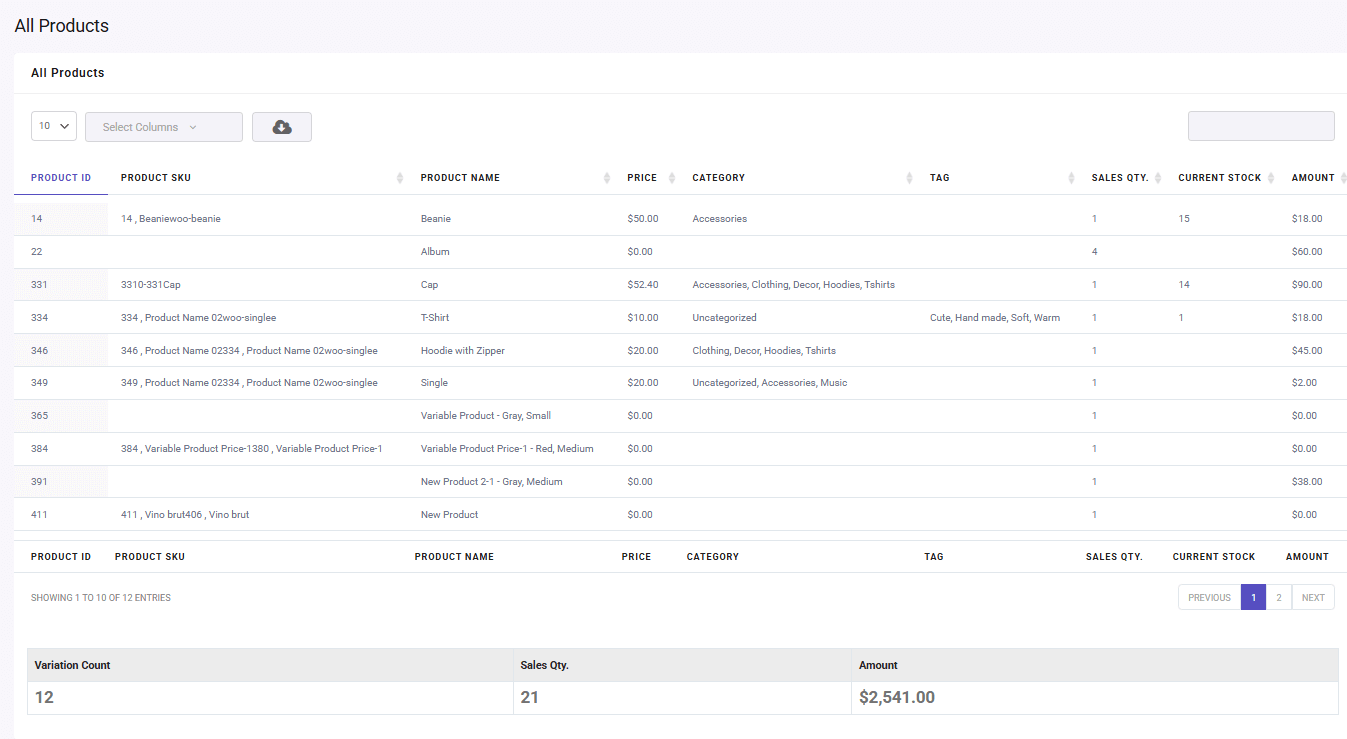
3. All Products Report
A comprehensive overview of every product’s performance, making it easy to compare sales, revenue, and profit margins.
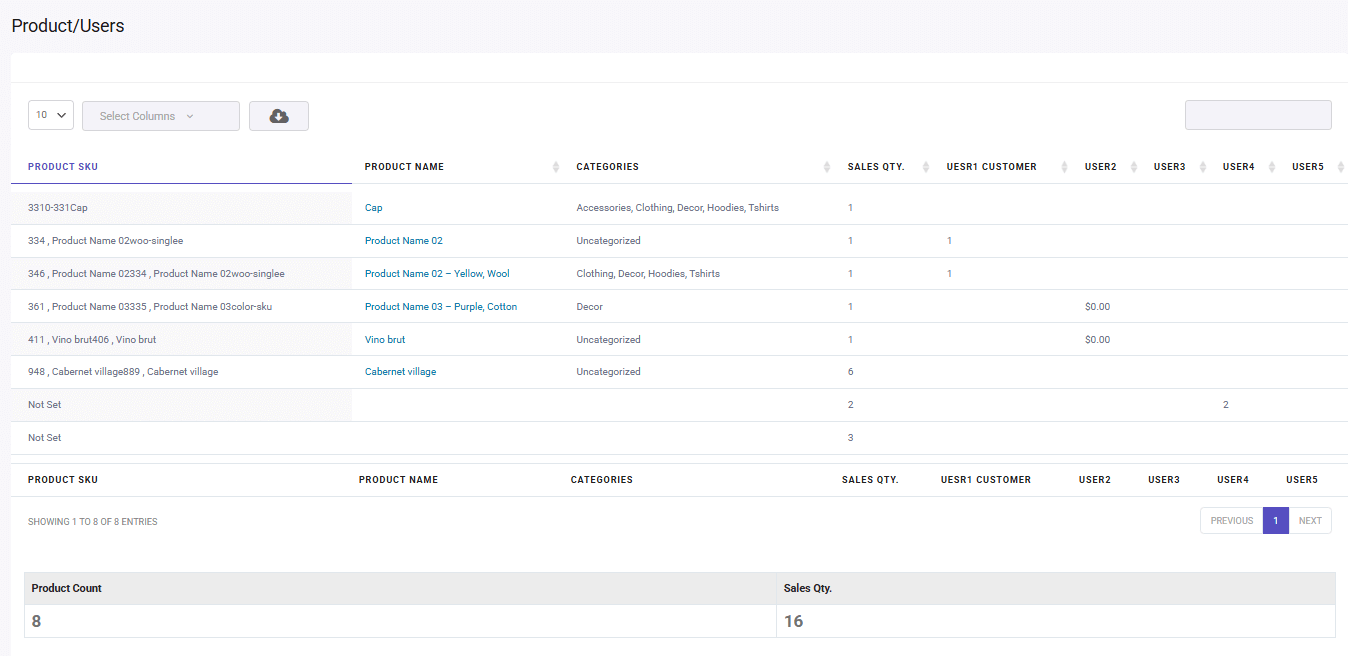
4. Product/Users Report
Analyzes which products attract the most unique buyers, useful for customer segmentation strategies.
Read more: 2 Easy Ways To Get WooCommerce Sales Report By User Role?
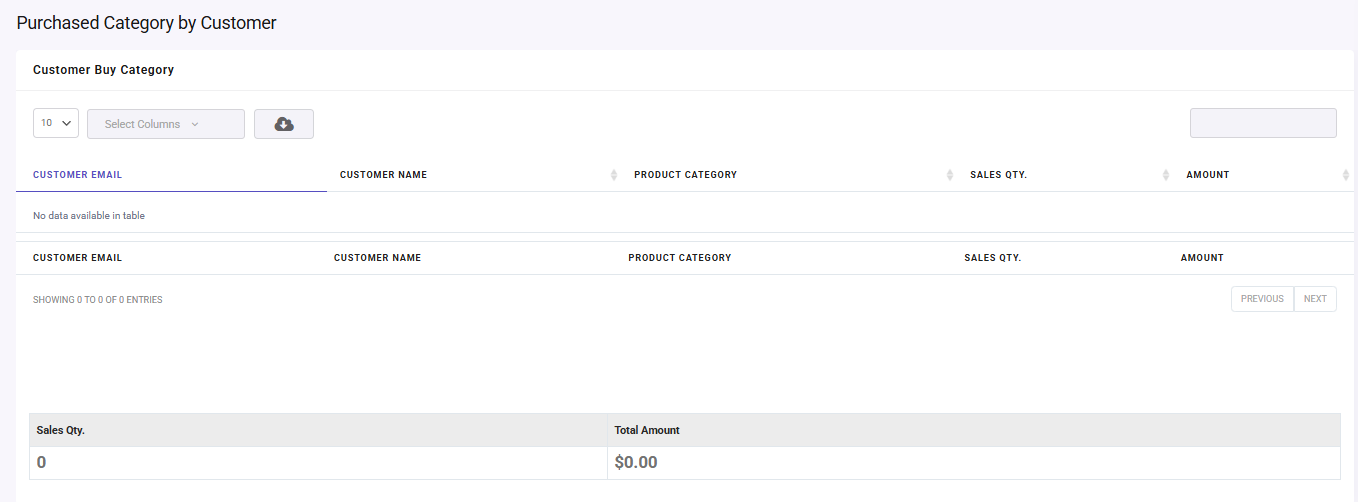
5. Purchased Category by Customer Report
Reveals which product categories resonate with different buyer groups for targeted marketing.
Read more: 2 easy ways to get WooCommerce product category sales report
6. Product Stock Report
Monitors inventory levels in real time, preventing stockouts of top sellers.
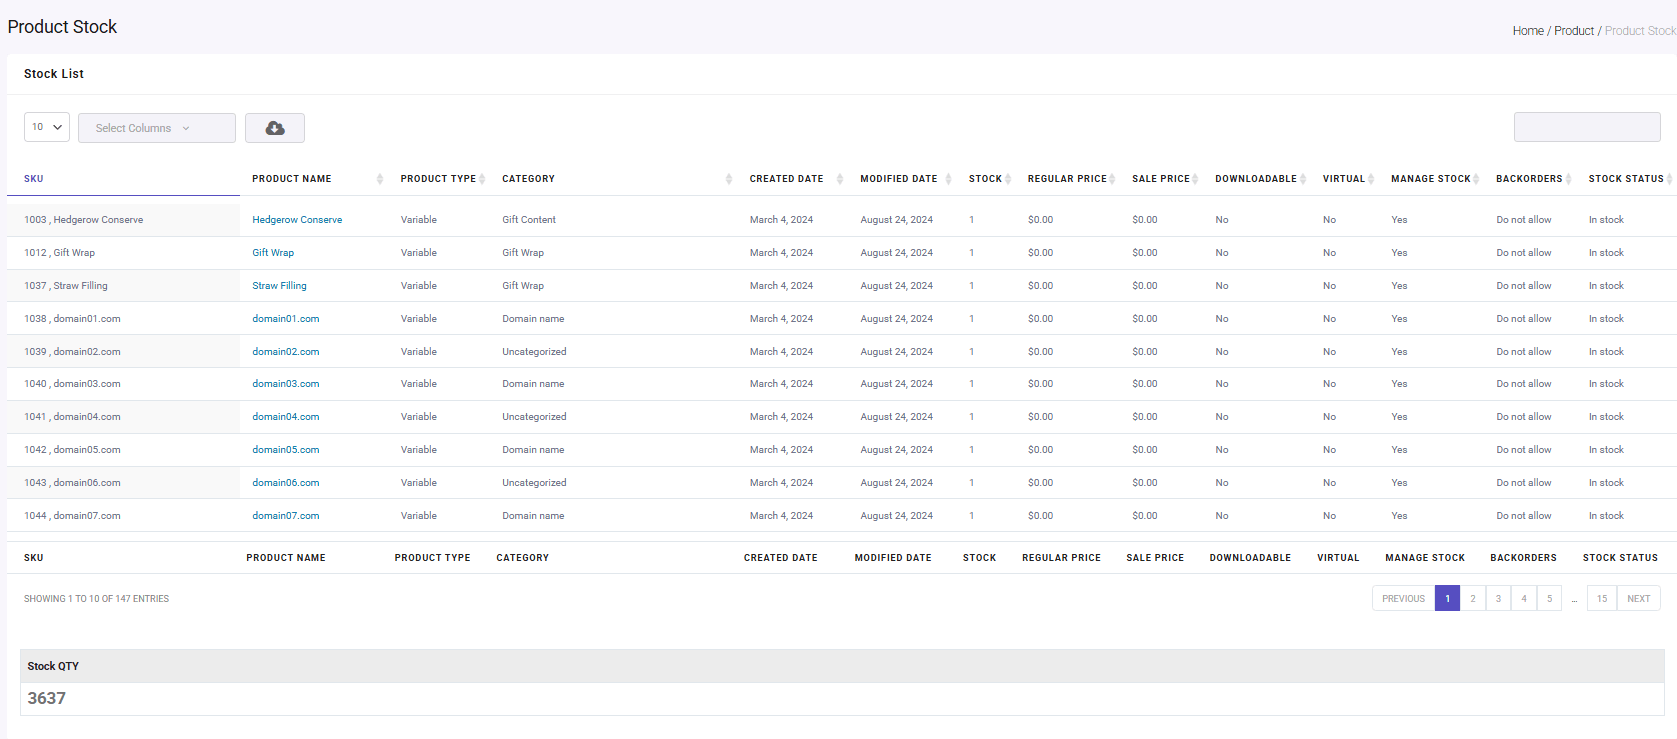
Read more: WooCommerce inventory report: 2 easy ways to get stock report in WooCommerce
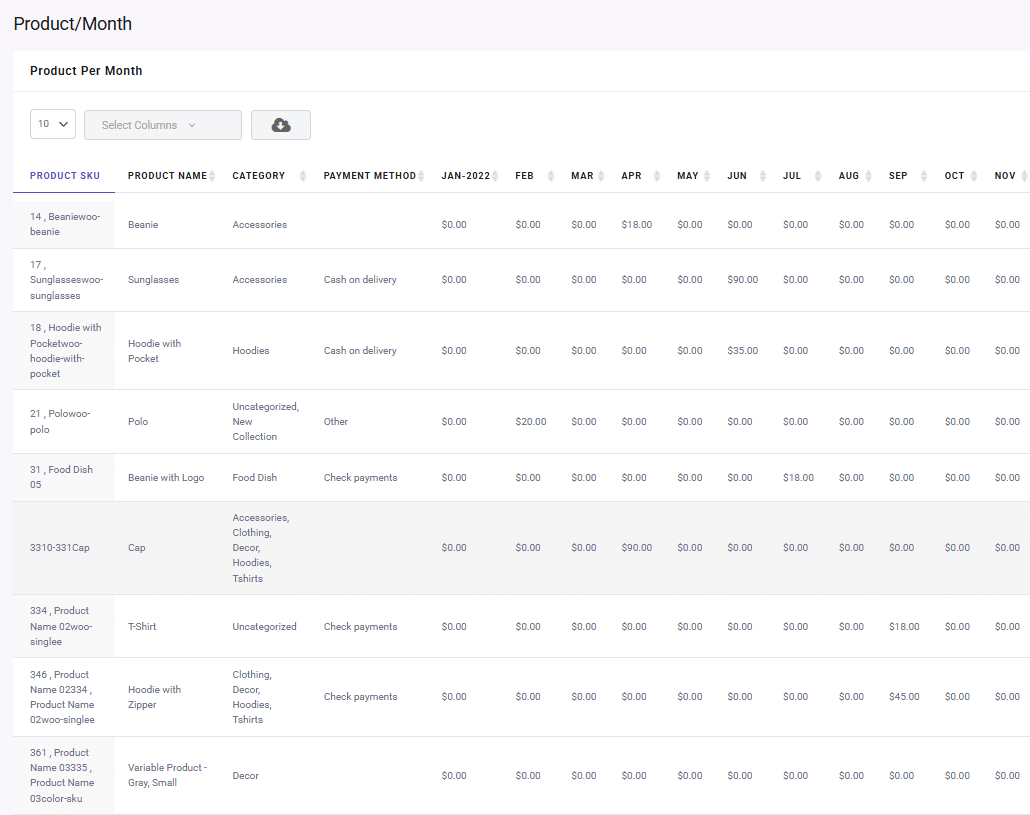
7. Product/Month Report
Highlights seasonal trends, allowing you to adjust promotions and stock based on monthly demand.
8. Product/Country Report
Shows geographic sales distribution, helping optimize international shipping and marketing.
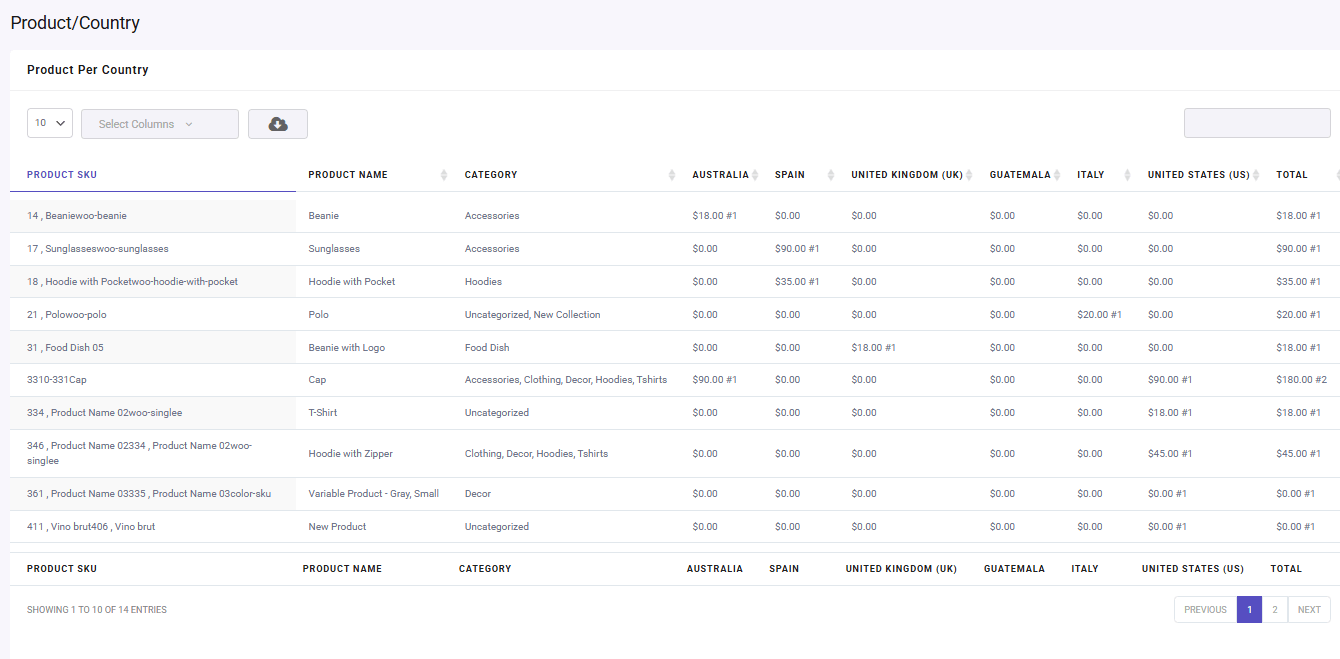
Read more: 2 easy ways to get sales by country report in WooCommerce
REPORTiT – Advanced WooCommerce Reporting
The easy way to turn product data into profit-driving insights in WooCommerce
Challenges and Tips for Effective Use of Advanced Reports
Below, we explore common obstacles and practical solutions to maximize the value of your product performance analytics, helping you better identify best-performing products and identify worst-performing products.
1. Overcoming Data Overload in Advanced Reports
When working with advanced reports, the sheer volume of metrics can be overwhelming. To avoid analysis paralysis, focus on 3-5 key indicators like conversion rates and profit margins using tools like the WooCommerce Reports plugin. This approach helps you quickly identify best-performing products while filtering out noise, ensuring you concentrate on metrics that truly impact your bottom line through effective product performance analytics.
2. Avoiding Misinterpretation of Product Data
A common pitfall in product performance analytics is judging success solely by sales volume. True insight comes from examining profit margins, customer segments, and return rates in your advanced reports. This deeper analysis prevents you from mistakenly promoting low-margin items while helping accurately identify worst-performing products that may be costing you money despite decent sales figures.
3. Ensuring Timely Data for Quick Decisions
The value of advanced reports diminishes if data isn’t current. Implement real-time syncing and automated alerts in your analytics tools to respond rapidly to stock issues or sales trends. By comparing weekly versus monthly data in your product performance analytics, you can spot emerging patterns faster, whether it’s a sudden surge in your best-performing products or early warning signs for declining items.
4. Strategic Handling of Underperforming Products
While advanced reports easily flag worst-performing products, the real challenge lies in taking smart action. Before discontinuing items, test small interventions like bundling or targeted promotions. Your product performance analytics should also consider external factors like seasonality, as today’s underperformer might be tomorrow’s bestseller with the right adjustments.
Conclusion: Key Takeaways for Businesses
Implementing advanced reports for product performance analytics transforms how businesses manage their product mix. The ability to identify best-performing products and worst-performing products with accuracy leads to:
- Higher profitability
- Reduced operational waste
- Better customer experiences
- Stronger competitive positioning
For WooCommerce stores, the WooCommerce Reports plugin make this level of analysis accessible without requiring data science expertise. By regularly reviewing these insights, e-commerce businesses can continuously refine their strategies for maximum growth.


