
Running a successful online store requires more than just listing products—it demands data-driven decision-making. A well-structured WooCommerce KPI dashboard gives you instant visibility into sales performance, customer behavior, marketing effectiveness, and profitability.
But what if WooCommerce’s default reporting tools aren’t enough? Don’t worry! The WooCommerce Reports plugin is here to help. With this powerful tool, you can generate custom reports, track key metrics, and even automate email deliveries to keep your team informed, without manual effort.
In this guide, we’ll explore the top KPIs you should track in your WooCommerce dashboard to gain actionable insights, optimize performance, and boost revenue.
Ready to transform your store with a smarter WooCommerce KPI dashboard? Let’s dive in!
What are KPIs and why do they matter?
KPIs (Key Performance Indicators) are measurable metrics that help you track the health and success of your business. They act as performance indicators, showing whether your store is meeting its goals, or where it needs improvement.
Why KPIs Matter for WooCommerce Stores?
- Data-Driven Decisions: Instead of guessing, you make choices based on real numbers.
- Identify Strengths & Weaknesses: Spot what’s working (e.g., best-selling products) and what’s not (e.g., high cart abandonment).
- Optimize Marketing Spend: Track ROI from ads, email campaigns, and promotions.
- Improve Customer Experience: Monitor trends like repeat purchase rates and refunds to enhance satisfaction.
- Boost Profitability: By tracking margins, AOV (Average Order Value), and conversion rates, you can increase revenue efficiently.
Without tracking KPIs, you’re essentially running your store with no guide. A well-structured WooCommerce KPI dashboard ensures you stay on top of your store’s performance, so you can grow smarter, not harder.
Let’s explore the most critical KPIs every WooCommerce store should track!
Top 10 KPIs for WooCommerce success
Whether you’re a store owner, marketer, or decision-maker, tracking these 10 critical KPIs will help you identify growth opportunities, fix underperforming areas, and maximize marketing ROI by improving customer retention.
Let’s break them down into sales, conversion, traffic, and customer behavior KPIs—with actionable insights to turn data into profit.
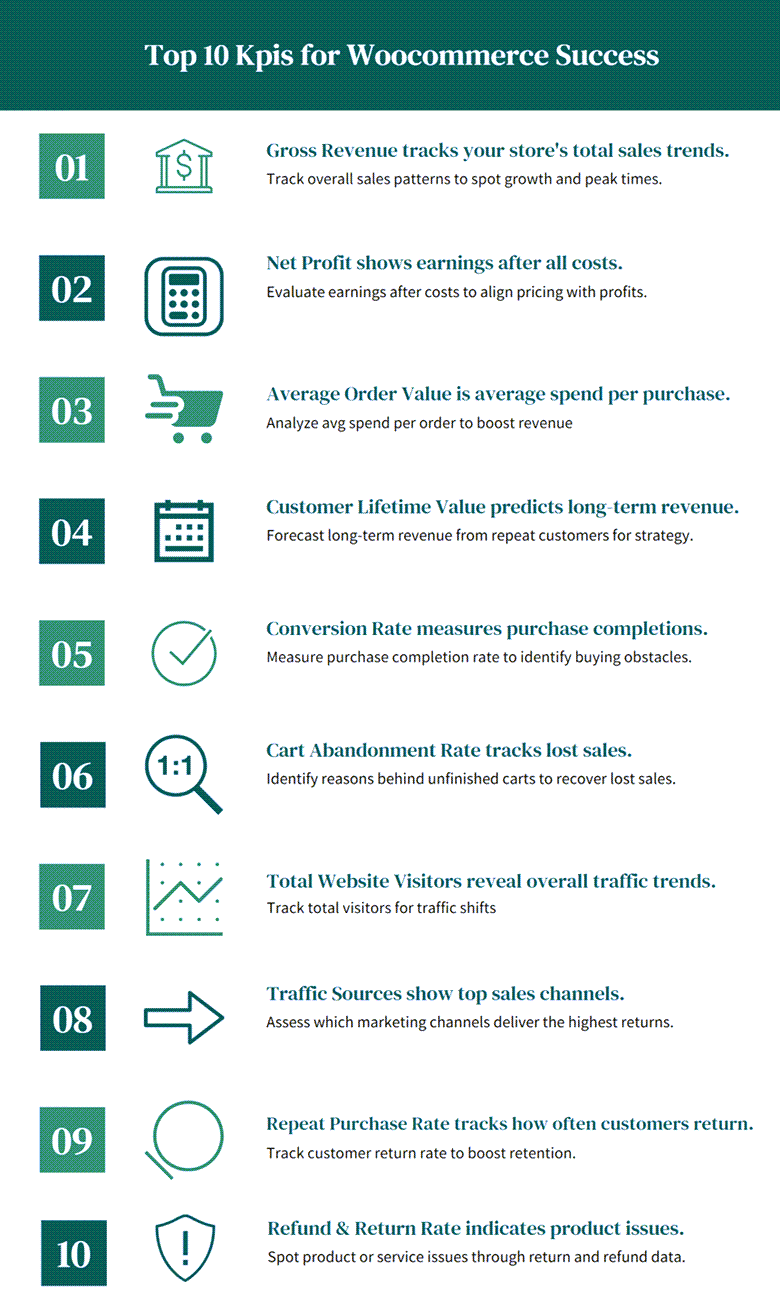
Sales Metrics: Tracking Revenue & Profitability
- Gross Revenue: This report shows your store’s total sales before any expenses. It helps track sales trends, peak periods, and overall performance.
Key data to analyze: Daily/weekly/monthly revenue trends, best-selling products, and seasonal fluctuations.
Use this in the WooCommerce KPI dashboard to adjust inventory and promotions for maximum sales.
- Net Profit: Net profit reveals your actual earnings after deducting costs (COGS, ads, fees, etc.). It indicates whether your pricing and expenses align with profitability goals.
Key data to analyze: Profit margins, major cost drivers, and areas where expenses can be reduced without impacting sales.
Actionable insight: If revenue is high but profit is low, reassess pricing or reduce overhead costs.
- Average Order Value (AOV): AOV measures the average amount spent per transaction. Increasing AOV boosts revenue without needing more customers.
Key data to analyze: customer spending patterns, effectiveness of upsells/bundles, and performance of free shipping thresholds.
- Customer Lifetime Value (CLV): CLV predicts long-term revenue from a single customer. Higher CLV means better retention and profitability.
Key data to analyze: Repeat purchase behavior, effectiveness of loyalty programs, and customer segmentation for targeted campaigns.
Actionable insight: Improve CLV with loyalty programs, email marketing, and personalized offers.
Conversion Metrics: Turning Visitors Into Buyers
- Conversion Rate: This metric in the WooCommerce KPI dashboard shows the percentage of visitors who make a purchase. A low rate indicates friction in the buying process.
Key data to analyze: Page performance, checkout drop-offs, and A/B test results for optimizing product pages and checkout flow.
Actionable insight: If the conversion rate is low, optimize the checkout process, improve product pages, or run retargeting ads.
- Cart Abandonment Rate: This report tracks lost sales from users who add items to their carts but don’t complete checkout.
Key data to analyze: Reasons for abandonment (shipping costs, account requirements)
Actionable insight: Reduce abandonment with exit-intent popups, email reminders, or simplified checkout.
Traffic Metrics: Understanding Your Audience
- Total Website Visitors: The Total Website Visitors report measures overall traffic to your store.
Key data to analyze: traffic trends, impact of SEO/social media/ads, and visitor engagement metrics.
Actionable insight: If traffic drops, you need to audit SEO, ads, or social media strategies.
- Traffic Sources (Organic, Paid, Social, Direct): This report in the WooCommerce KPI dashboard reveals which channels (organic, paid, social, direct) drive the most sales.
Key data to analyze: ROI per channel, top-performing campaigns, and underperforming sources needing optimization.
Customer Behavior KPIs: Retention & Engagement
- Repeat Purchase Rate: Repeat Purchase Rate tracks how many customers return to buy again. High retention means better profitability.
Key data to analyze: Customer segments with high/low retention, effectiveness of email marketing, and loyalty program engagement.
Actionable insight: Boost retention with email sequences, discounts, and free gift promotions.
- Refund & Return Rate: This report in the WooCommerce KPI dashboard indicates product quality or customer satisfaction issues. It can help you identify the common reasons for returns, problematic products, and ways to improve descriptions/quality control to reduce refunds.
Actionable insight: If the Refund & Return Rate is high, improve product descriptions, quality control, or customer support.
Tools to automate KPI reporting in WooCommerce
Tracking KPIs manually is time-consuming and prone to errors—that’s why automating your WooCommerce reports is essential for efficiency and accuracy. The right reporting tools help you visualize data, identify trends, and make faster decisions.
Let’s introduce the most powerful solutions with amazing features for automating KPI reporting in the WooCommerce KPI dashboard:
WooCommerce reports plugin
The WooCommerce reports plugin is the best solution for tracking and analyzing your store’s performance through a WooCommerce KPI dashboard. This powerful tool eliminates manual data crunching by providing 50+ advanced reports, covering everything from sales and customer behavior to taxes and coupon performance. With interactive dashboards featuring bar graphs and trend projections, you can visualize key metrics in real time, helping you make data-driven decisions faster.
One of the standout features of this plugin is its automation capabilities. Instead of manually exporting spreadsheets, you can schedule daily, weekly, or monthly email reports with the most critical KPIs delivered straight to your inbox.
The plugin also includes advanced search filters, allowing you to segment data by date range, product, customer group, or payment method for deeper analysis.
Additionally, all generated reports can be exported in PDF, CSV, or Excel formats for further review or sharing with stakeholders.
Whether you need to track total sales, inventory analysis, or customer sales report, this plugin provides a centralized, customizable dashboard to monitor all essential eCommerce KPIs efficiently.
Why It’s the Best Tool for WooCommerce KPI Tracking
- 50+ Advanced Reports – Track WooCommerce’s orders, products, customers, taxes, coupons, and more.
- Interactive Dashboards – Visualize data with bar graphs and projections.
- Automated Email Reports – Schedule daily, weekly, or monthly summaries.
- Advanced Search Filters – Drill down into data by date, product, customer, or payment method.
- Export Options – Download reports in PDF, CSV, or Excel for further analysis.
- Save hours of manual work – No more exporting CSVs or calculating metrics by hand.
- Real-time insights – Get up-to-date performance data at a glance.
- Customizable dashboards – Focus on the metrics that matter most to your business.
WooCommerce Analytics (Built-in)
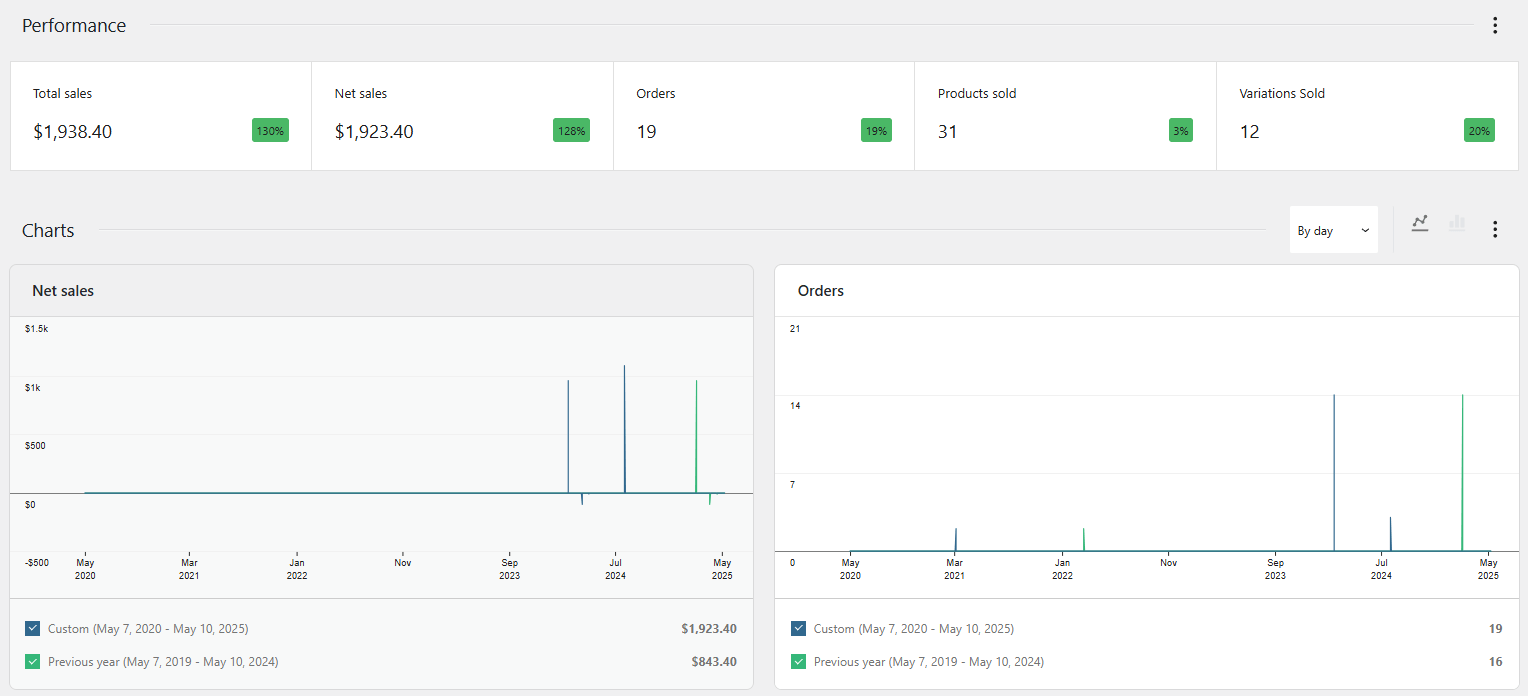
WooCommerce Analytics dashboard provides a free and integrated way to track basic sales, orders, and customer data. It’s useful for quick performance checks, but it lacks deep customization, automated email reports, and advanced visualizations.
Compared to the WooCommerce reports plugin, it falls short in flexibility and automation, making it less ideal for data-driven businesses that need detailed, scheduled insights.
Google Analytics for WooCommerce
Google Analytics for WooCommerce excels at tracking website traffic, user behavior, and acquisition channels, helping optimize marketing efforts. However, it doesn’t natively track key sales KPIs like net profit, AOV, or refund rates without complex setups.
Unlike the WooCommerce Reports Plugin, it requires manual integration and lacks dedicated eCommerce dashboards, making it less efficient for real-time sales performance tracking.
Metorik

Metorik is a robust tool for subscription-based stores and deep customer insights, offering retention analytics and cohort reporting. However, at $49+/month, it’s expensive for small stores and includes features many businesses don’t need.
The WooCommerce Reports Plugin provides a more cost-effective, streamlined solution with automated reporting and essential KPI tracking without unnecessary complexity.
Power BI
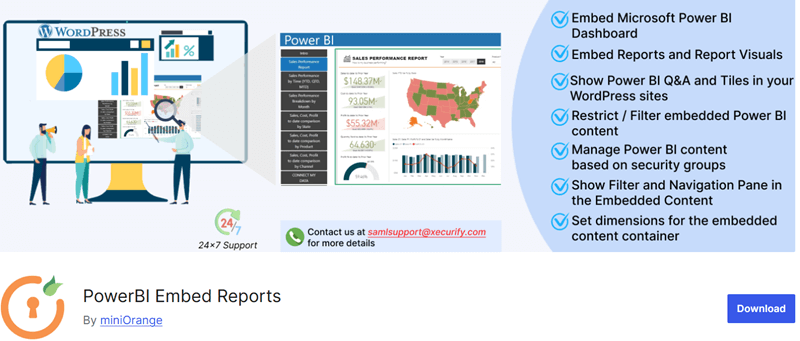
Power BI is an enterprise-grade BI tool that is used for large datasets and custom visualizations, and is ideal for advanced data analysis. However, they have a steep learning curve and require manual data imports or complex integrations.
By leveraging these third-party plugins, you can gain actionable insights to drive growth.
Next, we’ll dive deeper into visualizing data in your dashboard, explaining how to transform raw metrics into clear, actionable insights using dynamic dashboards. Stay tuned!
Visualizing data in your dashboard
With the WooCommerce reports plugin, you get a comprehensive dashboard that transforms complex data into actionable insights through interactive tables and visual charts.
This plugin provides real-time, customizable visualizations—all in one centralized dashboard. Unlike manual reporting or generic analytics tools, it delivers WooCommerce-specific KPIs in an easy-to-understand format, helping you quickly identify opportunities and optimize performance without digging through spreadsheets.
Let’s review the KPI reports in the WooCommerce report plugin dashboard:
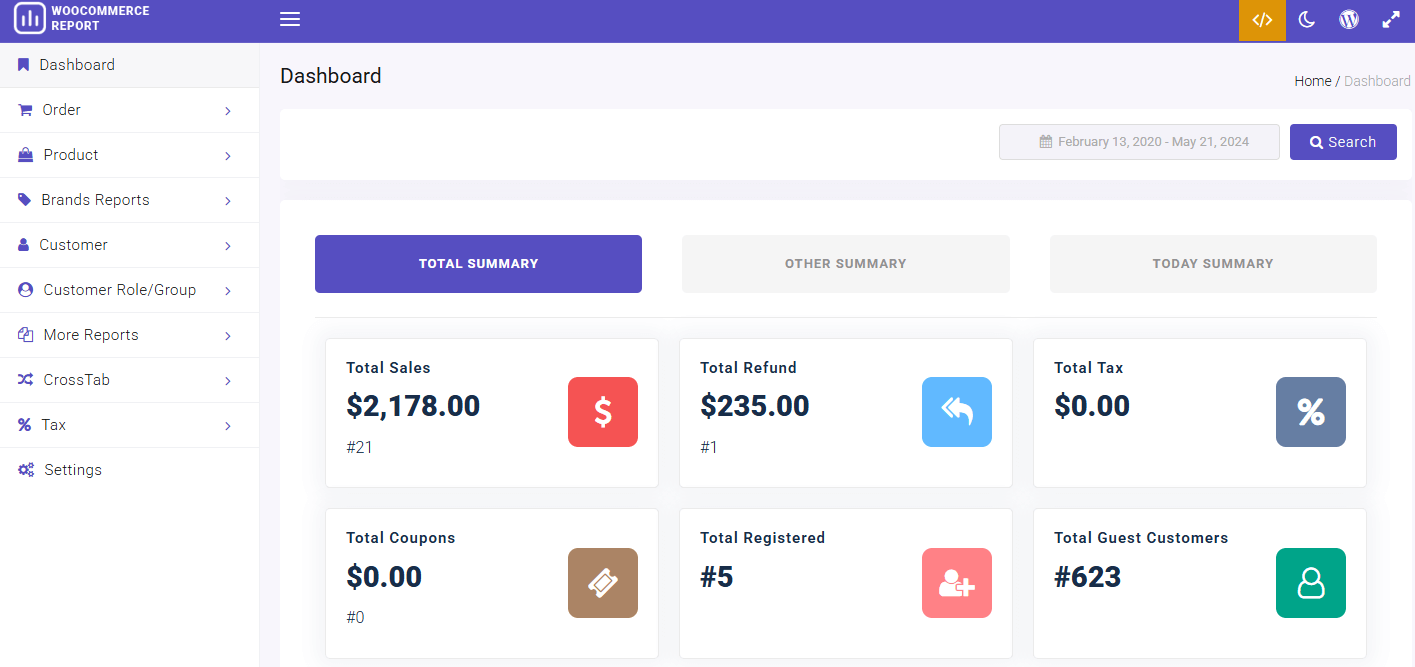
Summery Reports
The first section of the WooCommerce reports plugin dashboard features an intuitive dashboard with three key tabs:
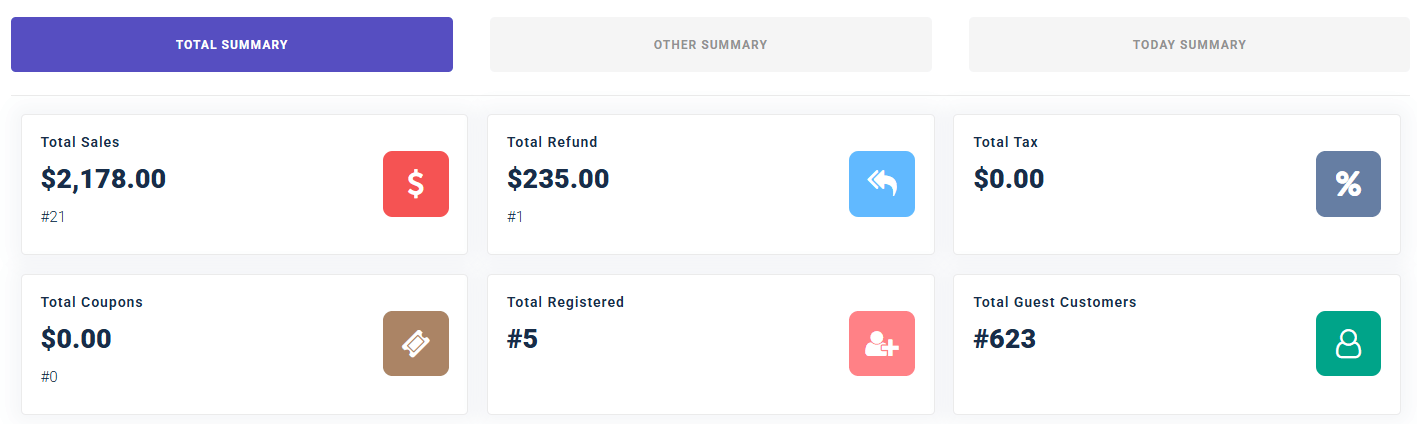
- Total Summary – Provides a high-level overview of your store’s performance with essential KPIs, including:
- Total Sales: Shows your store’s gross revenue (sum of all orders) and total number of orders placed.
- Total Refunds: Displays the total amount refunded to customers and the count of refund transactions processed.
- Total Tax: Indicates the sum of all taxes collected on orders (important for accounting and compliance).
- Total Coupons Used: Reveals how many discount coupons were redeemed (helps measure promotion effectiveness).
- Total Registered Customers: Counts customers who created accounts (useful for loyalty program tracking).
- Total Guest Customers: Shows checkout completions without account creation (indicates checkout experience quality).
The Total Summary tab is the most critical, as it highlights the most important WooCommerce KPIs at a glance, helping you monitor sales, refunds, customer behavior, and promotions efficiently. With clear, visual data presentation, you can quickly assess performance and make data-driven decisions.
- Other Summary – Displays additional metrics for deeper analysis, including:
- Cur. Yr Proj. Sales – Show total projected sales for the current year.
- Current Year Sales – Actual sales revenue generated in this year.
- Average Sales Per Order – The typical order value in average.
- Average Sales Per Day – Daily revenue average.
- Current Month Sales (May 2025) – Total sales for this month.
- Cur. Month Proj. Sales (May 2025) – Projected sales for this month.
- Order Tax – Total tax collected on orders.
- and more
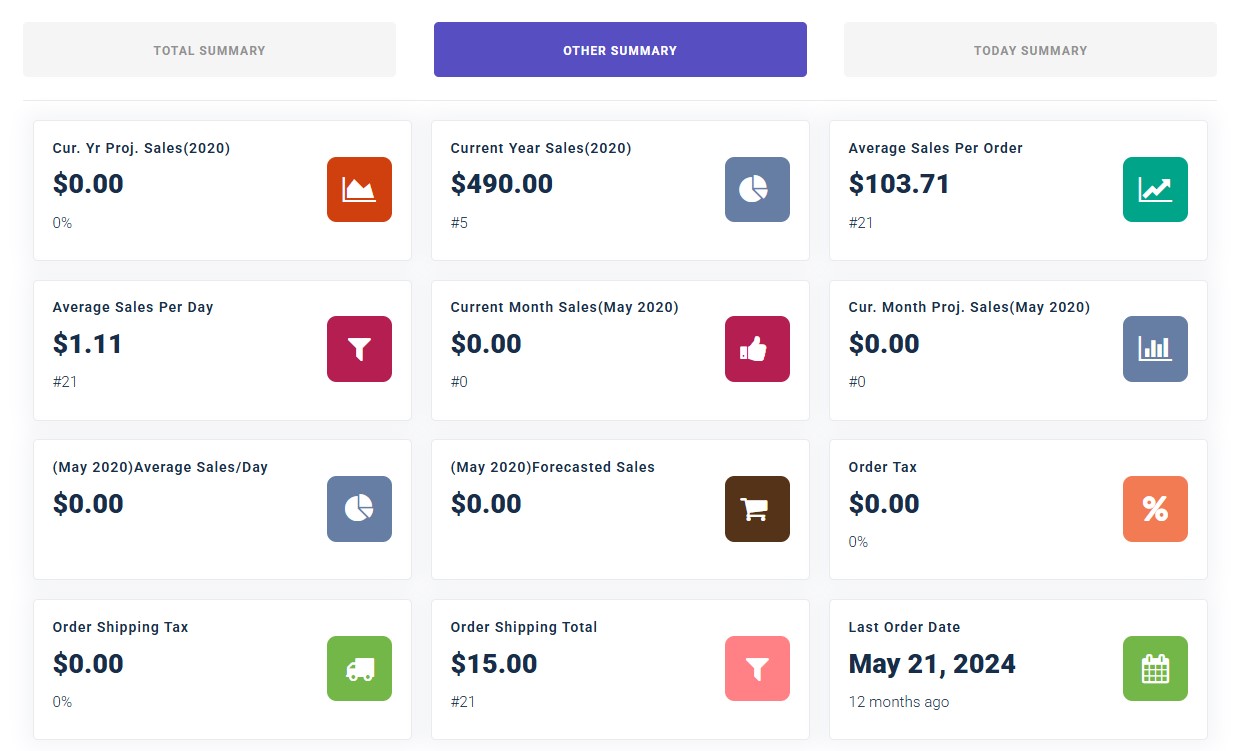
- Today Summary – Focuses on real-time daily performance.
Visual Chart in the WooCommerce KPI Dashboard
The second section features powerful Visual Charts that transform your data into intuitive graphical representations across multiple tabs:
- Sales By Weeks – A trend chart showing weekly sales performance to identify high/low revenue periods.
- Sales By Months – A monthly sales overview for spotting long-term growth patterns and seasonality.
- Sales By Days – Daily sales breakdown to track short-term fluctuations and campaign impacts.
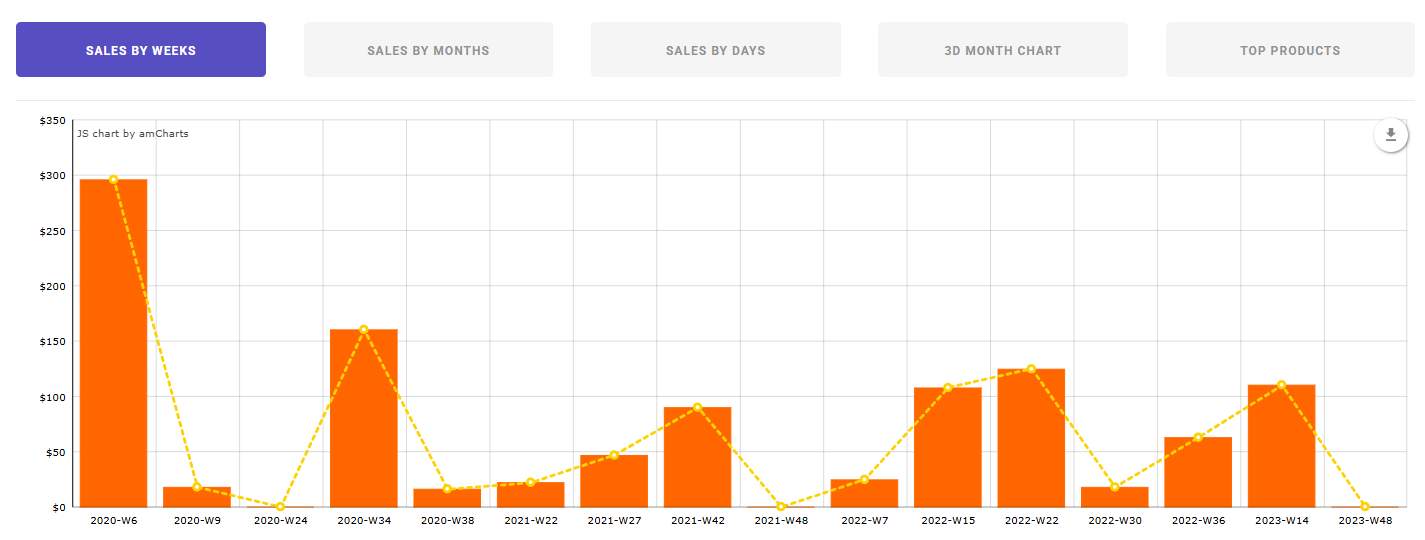
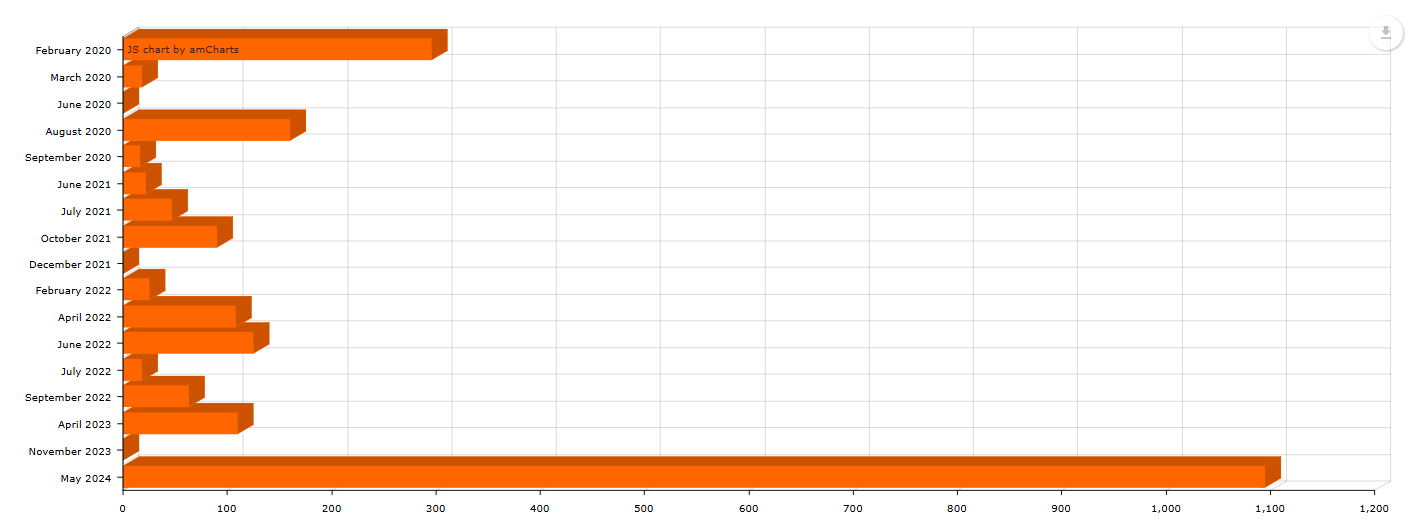
- 3D Month Chart – An engaging 3D visualization of monthly sales data for enhanced perspective.
- Top Products – A bar chart ranking best-selling products by revenue or quantity.
Simply click any tab in this section of the WooCommerce KPI dashboard to instantly generate the corresponding chart, making it easy to analyze trends and optimize strategies visually. Unlike manual reports, these dynamic charts update in real-time, helping you make faster, data-driven decisions for your store.
Monthly Summary Report
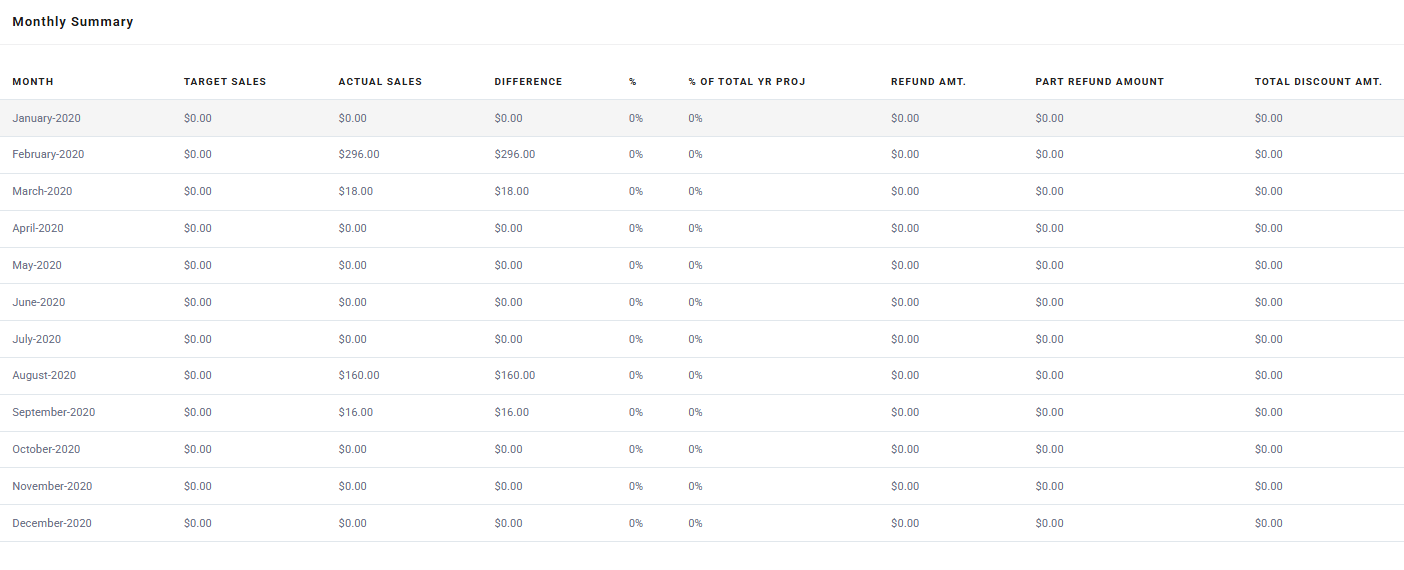
This table provides a quick snapshot of monthly performance, highlighting where you’re exceeding targets or need adjustments. The percentage of total year projected goals column is especially useful for forecasting annual revenue.
Here’s a breakdown of each column in the Monthly Summary table:
- Month – The calendar month being analyzed (e.g., January, February).
- Target Sales – Your predefined sales goal for that month (helps measure performance against objectives).
- Actual Sales – The real revenue generated (You can compare with targets to gauge success).
- Difference – The gap between Target and Actual Sales (positive/negative values show over/underperformance).
- % – The percentage difference between target and actual sales (quantifies variance).
- % of Total YR PROJ – How much that month’s sales contribute to your annual projected revenue (track progress toward yearly goals).
- Refund Amt. – Total value of full refunds issued (impacts net revenue).
- Part Refund Amount – Partial refunds given (e.g., for returned items or discounts).
- Total Discount Amt. – Sum of discounts applied (coupons, promotions, etc.).
REPORTiT – Advanced WooCommerce Reporting
The easy way to track your WooCommerce reports KPI
Tabular reports in the WooCommerce KPI dashboard
These reports are critical for data-driven decisions, helping you boost sales, streamline operations, and enhance customer experience.
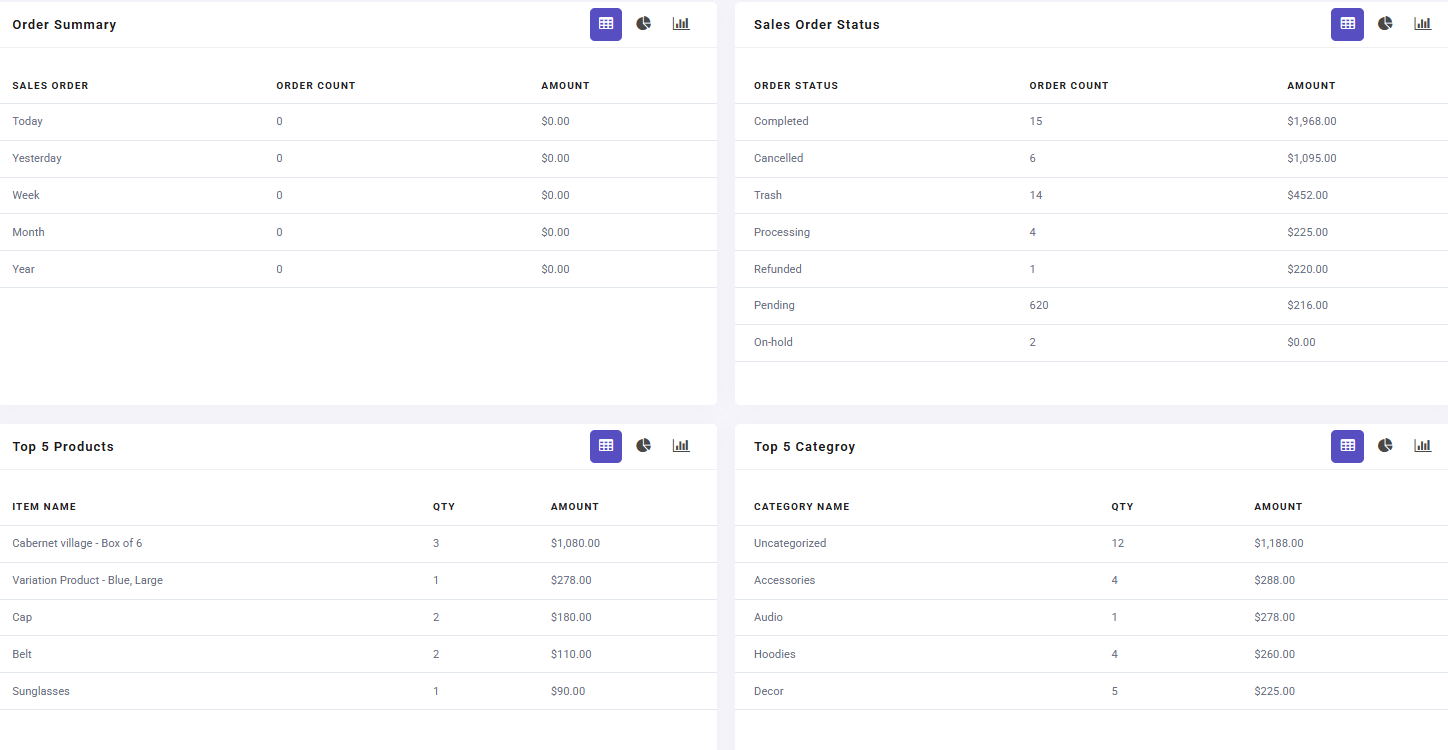
Order Summary
Overview of total orders, sales, refunds, and net revenue to help you track overall store performance and financial health.
Sales Order Status
A breakdown of orders by status (Processing, Completed, Failed, etc.) is useful for identifying bottlenecks in fulfillment and payment processing.
Top 5 Products
Best-selling items by revenue or quantity to highlight popular products to optimize stock and promotions.
Top 5 Category
Highest-performing product categories reveal trending niches to focus marketing efforts.
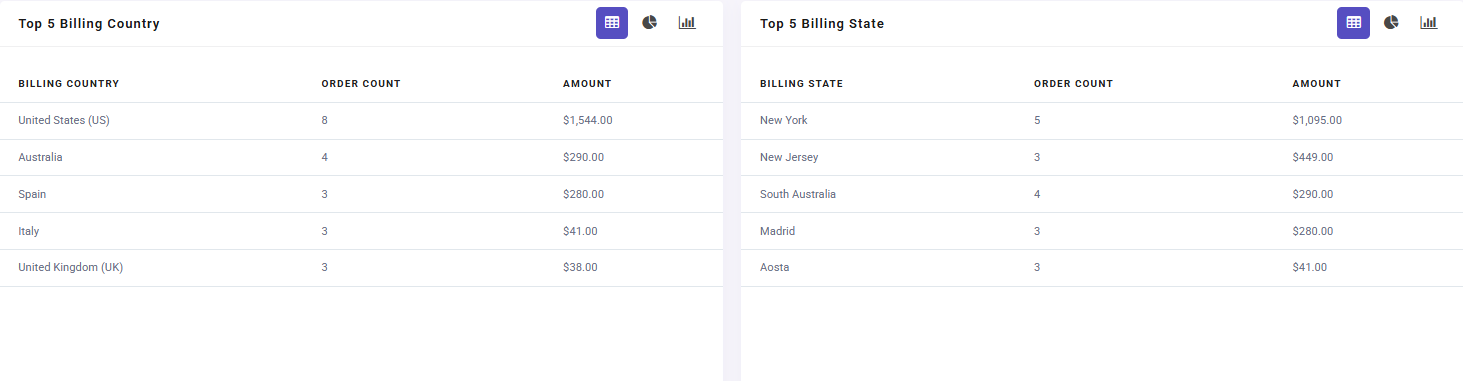
Top 5 Billing Countries
Countries generating the most sales, guiding geo-targeted ads, and shipping strategies.
Top 5 Billing States
Highest-converting states/regions helping you to localize campaigns and inventory distribution.
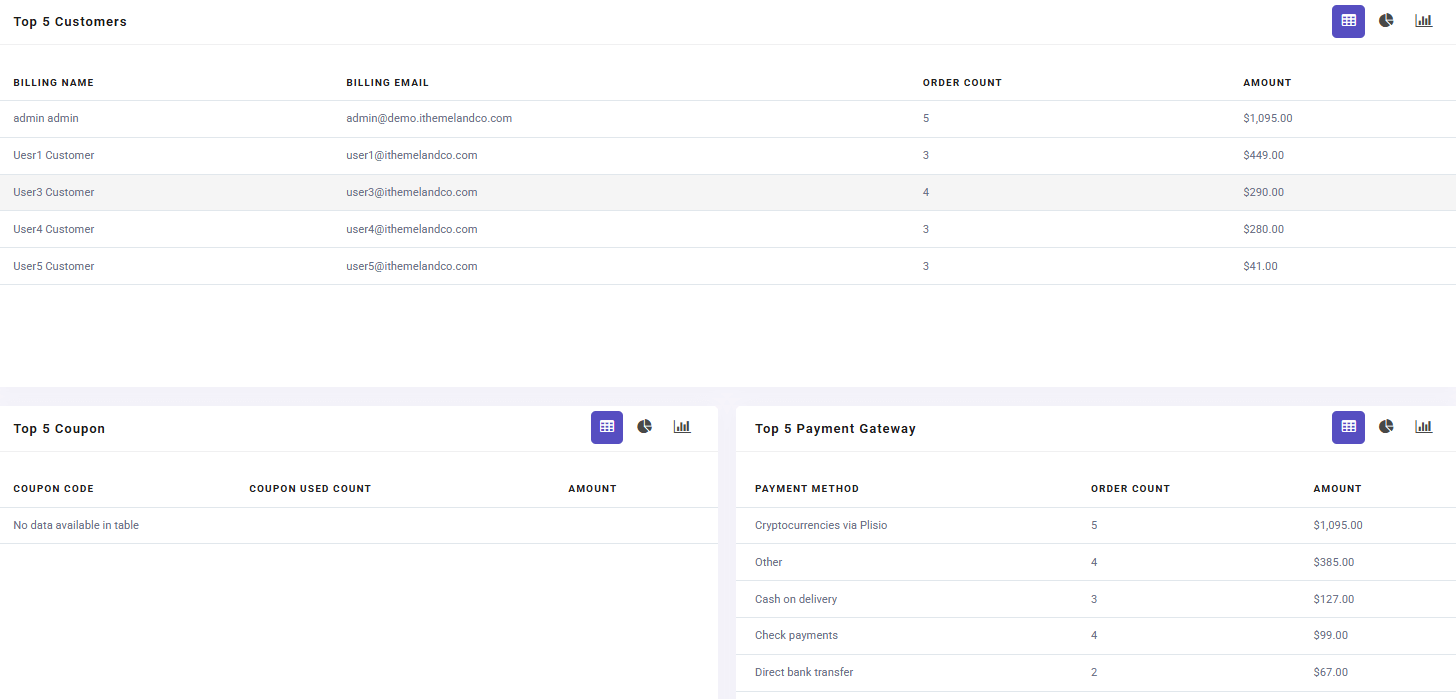
Top 5 Customers
Highest-spending or most frequent buyers are useful for targeting loyalty programs and retention campaigns.
Top 5 Coupons
Most-used discount codes for measuring campaign effectiveness and customer incentives.
Top 5 Payment Gateways
Preferred payment methods (e.g., PayPal, Credit Card) to optimize checkout options for higher conversions.
Essential WooCommerce Reports to Track Your Store’s KPI
In today’s data-driven ecommerce landscape, simply having access to numbers isn’t enough – you need the right reports that transform raw data into actionable business intelligence. The WooCommerce report Plugin provides comprehensive analytics capabilities that go far beyond basic sales tracking in WooCommerce KPI dashboard, offering store owners deep visibility into every aspect of their operations.
1. Comprehensive Sales Performance Report
This report includes a table with columns such as Order ID, Name, Last Name, Customer, Email, Phone No., Date, Country, State, Status, Payment Method, Coupon Code, Products, SKU, Category, Variation, Qty., Rate, Prod. Amt., Prod. Discount, Shipping Amt., Net Amt., and Invoice Action.
Key Data Points for WooCommerce KPI Dashboard:
- Order Status – Track completed, pending, and canceled orders to measure conversion rates and identify bottlenecks.
- Payment Method – Analyze popular payment gateways to optimize checkout options and reduce cart abandonment.
- Net Amount (Net Amt.) – Monitor total revenue trends over time to evaluate sales performance.
- Quantity (Qty.) & Product Amount (Prod. Amt.) – Identify best-selling products and adjust inventory strategies accordingly.
- Coupon Code Usage – Measure the impact of discounts on sales and refine promotional campaigns.
- Product Category Performance – Compare sales across categories to focus on high-profit segments.
- Country/State Data – Identify top-performing regions for targeted marketing and logistics optimization.
- Product Discounts (Prod. Discount) – Assess how discounts affect profitability and adjust pricing strategies.
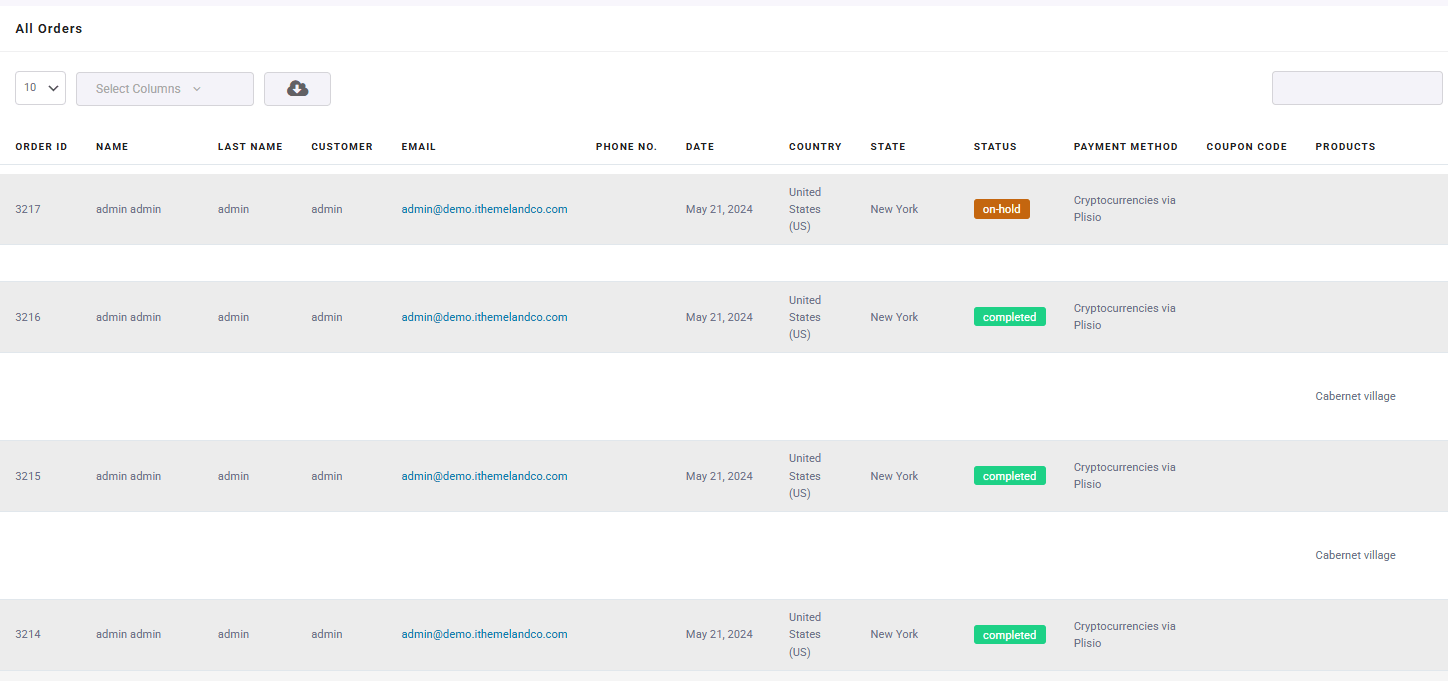
By analyzing these KPIs in your WooCommerce dashboard, you can optimize sales, improve customer experience, and make data-driven decisions.
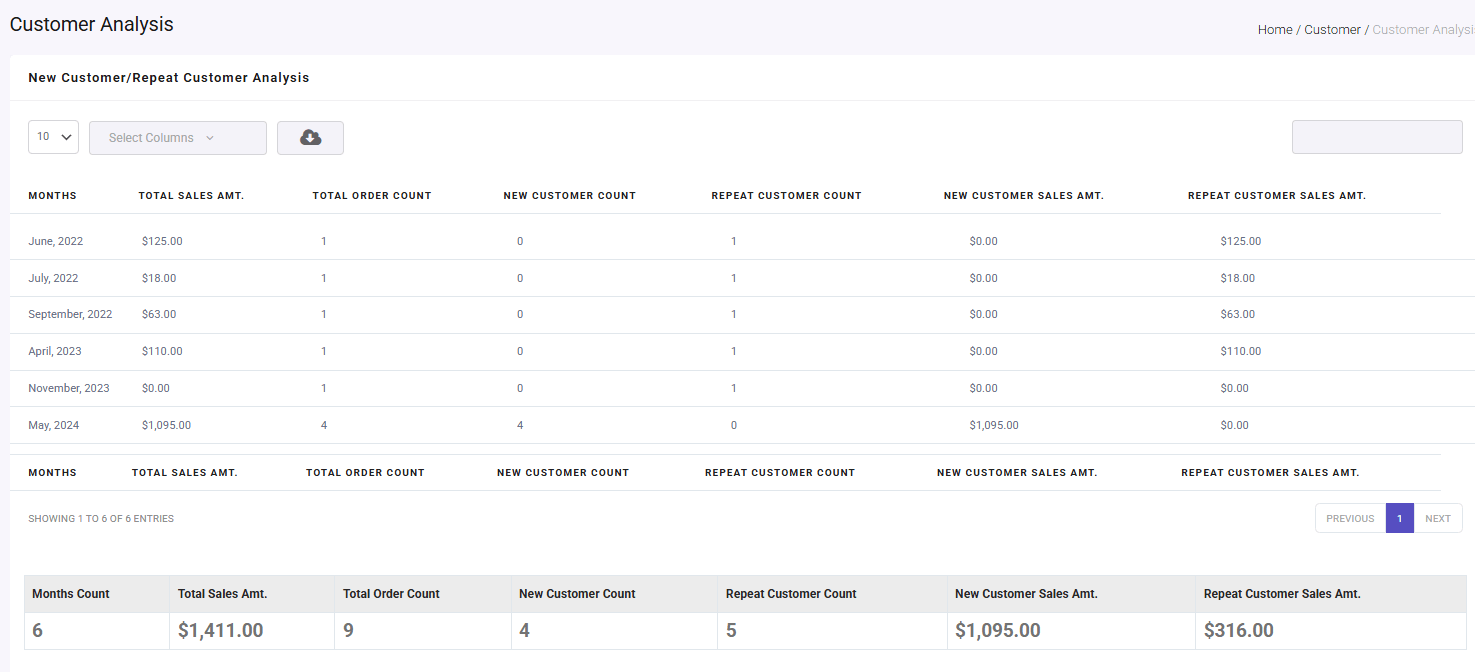
2. Customer Acquisition & Retention Analysis
This report includes metrics like Months, Total Sales Amt., Total Order Count, New Customer Count, Repeat Customer Count, New Customer Sales Amt., and Repeat Customer Sales Amt.
Key Insights for WooCommerce KPI Dashboard:
- New vs. Repeat Customer Count – Compare acquisition (new customers) vs. retention (repeat buyers) to assess loyalty and marketing effectiveness.
- New Customer Sales vs. Repeat Customer Sales – Determine whether revenue comes mostly from new or returning customers to refine retention strategies.
- Total Sales & Order Trends (Monthly) – Track growth over time to identify seasonal patterns and measure campaign success.
- Repeat Purchase Rate – Calculate Repeat Customer Count / Total Customers to evaluate customer loyalty and satisfaction.
- Average Order Value (AOV) Comparison – Compare New Customer Sales Amt./New Orders vs. Repeat Customer Sales Amt./Repeat Orders to see if loyal customers spend more.
How to use these insights:
- Improve Retention: If repeat sales are low, implement loyalty programs or email remarketing.
- Optimize Acquisition: If new customer growth is stagnant, boost ads or referral campaigns.
- Increase CLV (Customer Lifetime Value): Encourage repeat purchases with personalized offers.
By monitoring these metrics, you can balance acquisition costs with long-term customer value.
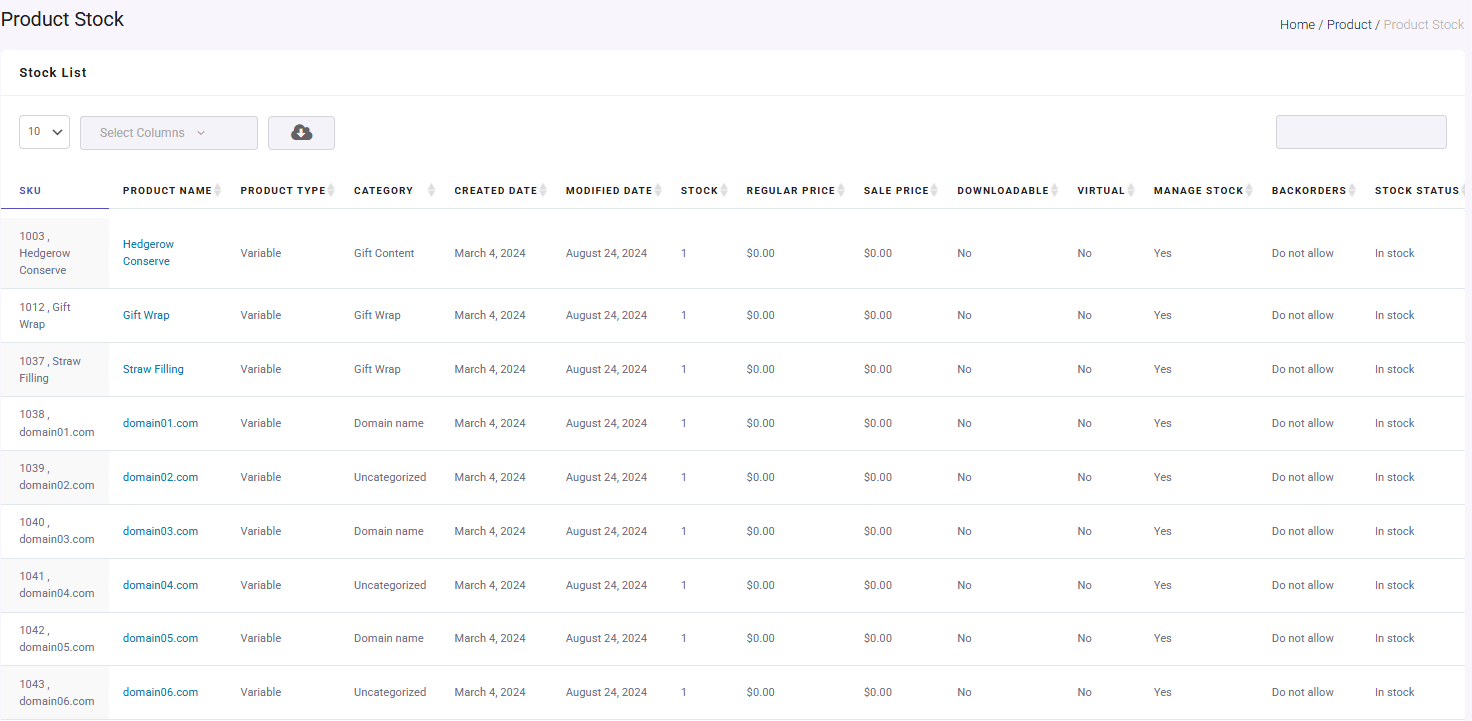
3. Inventory Report
This report tracks Stock Quantity, SKU, and Price for your products. Here’s how to leverage it in your WooCommerce KPI dashboard:
Key Data Points to Monitor:
- Stock Quantity – Identify low-stock or out-of-stock items to prevent lost sales and optimize restocking.
- SKU-Based Tracking – Analyze inventory turnover for each SKU to detect fast/slow-moving products.
- Price vs. Stock Levels – Compare pricing with stock status to adjust discounts (e.g., clear slow sellers) or increase margins on high-demand items.
Actionable Insights:
- Avoid Stockouts: Set up alerts for critical stock levels.
- Reduce Dead Stock: Discount or bundle stagnant inventory.
- Pricing Strategy: Raise prices for low-stock/high-demand items.
Use this data to maintain optimal inventory levels and maximize profitability.
The WooCommerce report plugin transforms these complex datasets into clear, visual WooCommerce KPI dashboard with filtering capabilities that let you drill down to specific time periods, products, or customer segments.
Automated email reporting ensures you never miss important trends, while export functionality allows for deeper analysis in spreadsheets or advanced tools.
REPORTiT – Advanced WooCommerce Reporting
The easy way to track your WooCommerce reports KPI
Conclusion
Tracking the right KPIs is the key to unlocking your store’s full potential, but without the right tools, data can feel overwhelming. The WooCommerce report plugin solves this by automating reports, visualizing trends, and delivering actionable insights—all in one powerful WooCommerce KPI dashboard.
Whether you need to boost sales, optimize marketing, or improve customer retention, this plugin gives you real-time, customizable reports without manual work.