


Every transaction, every click, and every cart is telling a story, you just need to analyze sales data to understand customer behavior and start implementing win-win strategies for more success. But how do you unlock these secrets? The answer lies in mastering sales data analysis and identifying Bestselling and Underperforming Products.
Today, with powerful tools like the WooCommerce Reports plugin, guesswork is a thing of the past. This plugin empowers you to effortlessly pinpoint your store’s true champions—Sales and Product performance analysis. This process is not merely about generating reports; it’s about charting a course for smarter strategies, increased profitability, and transforming casual browsers into loyal customers.
Let’s get you through the compelling world of data, showing you how intelligent analysis can revolutionize your business.
Definition of Sales Data and Its Importance
Sales data refers to the quantitative and qualitative information collected throughout the process of selling products or services. This data encompasses a wide range of metrics, including but not limited to:
- Units sold,
- Revenue generated,
- Profit margins,
- Customer information,
- Transaction dates,
- Product categories,
- And return rates.
Its Importance is paramount for any business as it serves as the foundational evidence for strategic decision-making. Sales data analysis allows businesses to:
- Understand market demand and customer preferences.
- Measure the effectiveness of marketing and sales campaigns.
- Identify Best-selling products and Underperforming products to forecast future sales.
- Optimize inventory management to reduce overhead costs.
Benefits of Identifying Best-Selling and Underperforming Products
Product performance analysis is a critical outcome of effective sales data analysis. The benefits are strategic and impact nearly every part of a business:
- Optimized Inventory Management
- Strategic Marketing and Resource Allocation
- Improved Financial Performance
- Data-Driven Product Strategy
- Enhanced Customer Satisfaction
Required Data for Sales Analysis
Effective sales data analysis relies on integrating multiple data points to form a complete picture of performance. The essential data required can be categorized as follows:
| Data Category | Specific Data Points | Purpose & Importance |
|---|---|---|
| Transactional Data | Product ID/SKU, Quantity Sold, Revenue, Date/Time, Transaction ID | Tracks volume, revenue trends, and seasonality. Links products bought together. |
| Product Data | Product Category, Cost of Goods Sold (COGS), Supplier | Calculates true profitability (margin), and analyzes performance by category and supplier. |
| Customer Data | Customer ID, Demographics (Location, Age), Customer Type (New/Returning) | Identifies target audiences and customer segments for best-selling products. |
| Operational Data | Inventory Levels, Return/Refund Rates, Marketing Channel (e.g., Google Ad, Email) | Prevents stockouts, identifies problematic products, and measures marketing ROI. |
Methods of Collecting Sales Data
Identifying Best-selling products, and Underperforming products, is crucial for any e-commerce business. WooCommerce provides built-in and extended ways to do this.
Here are two primary methods:
Method 1: Using Native WooCommerce Analytics
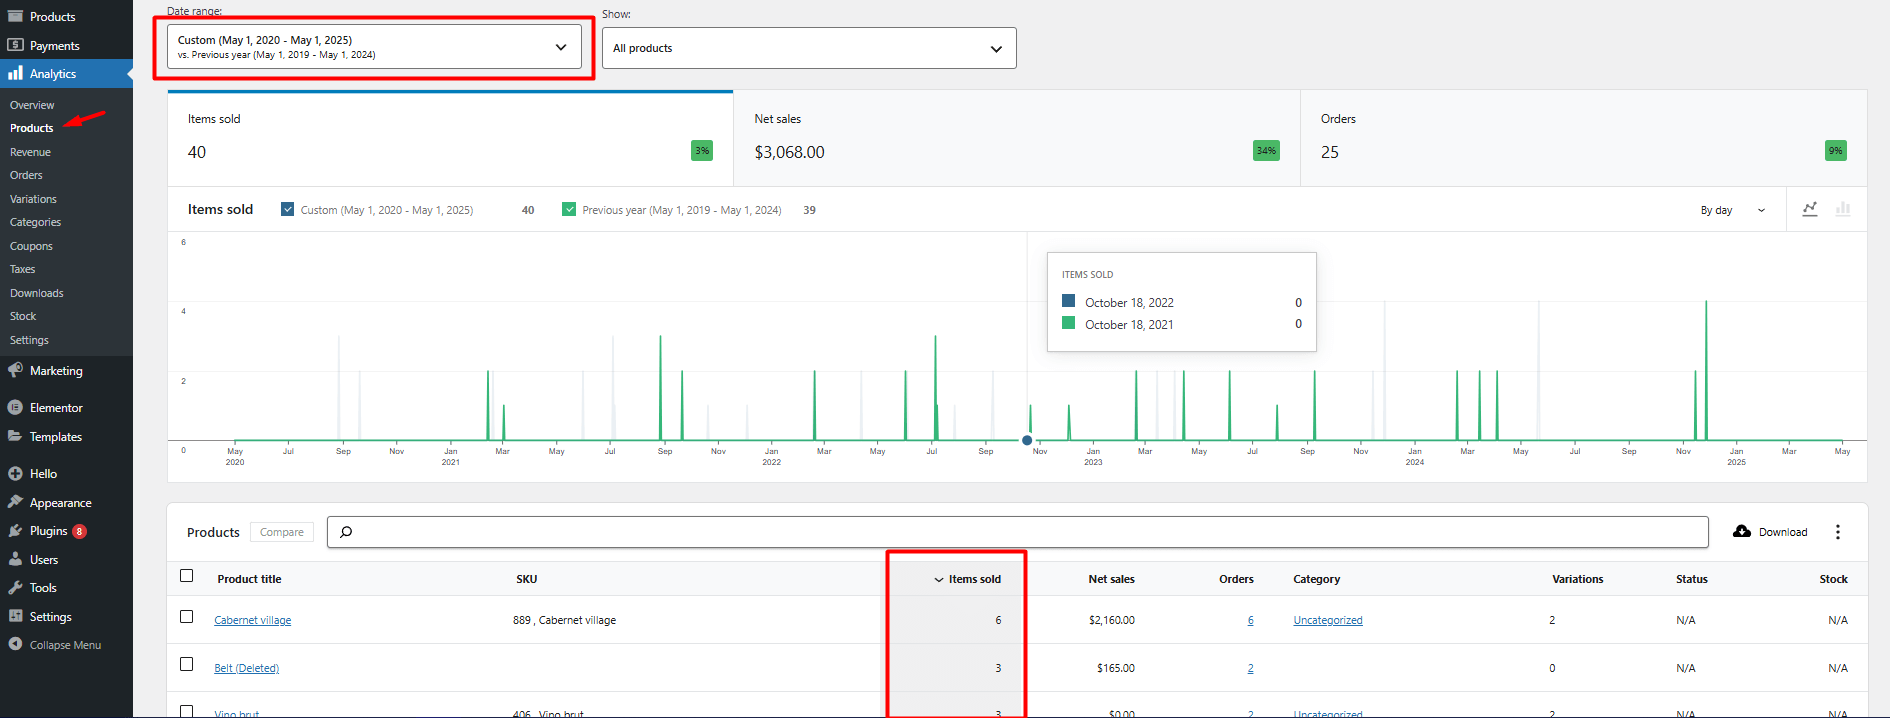
The WooCommerce analytics dashboard, integrated directly into your WordPress admin, provides a powerful and user-friendly way to track your store’s product performance analysis without additional plugins. It offers an overview of revenue, orders, items sold, and more.
To use this tool, follow the below steps:
- From your WordPress admin menu, navigate to WooCommerce > Analytics.
- Navigate to the Products Report on the Analytics main menu.
- At the top of the report, you will find a date filter. Select the custom date range you want to analyze.
- After selecting the date range, the report will automatically update. You will see a list of products, typically ordered by the number of items sold (Qty) in descending order.
Method 2: Using WooCommerce Report Plugin
For more detailed and customizable reports beyond the native analytics, you can use WooCommerce report plugin. It comes with amazing features allowing you for deep filtering and customization in product performance analysis.
Here, you can find the Step-by-Step Guide to use WooCommerce report plugin:
STEP 1: Install and Activate WooCommerce report plugin
- Download the ZIP File of the plugin
- In your WordPress admin, go to Plugins > Add New.
- Click the Upload Plugin button then Choose File
- Select the plugin’s ZIP file from your computer, and then click Install Now.
- After installation, back to WordPress Dashboard, and open iThemeland menu just appeared.
- Click the License option and insert the License key in the Activation form to have access to all features of the plugin
Step 2: Generate sales Report
Once the plugin is activated, navigate to iThemeland > Woo Report.
In the main page, you can find a list of all required reports divided into different tabs including Orders, Products, Customers, etc. There are more than 50+ reports you can Generate based on your needs just with one click.
For generating Product performance analysis, open the Product tab and select Purchased Products report.
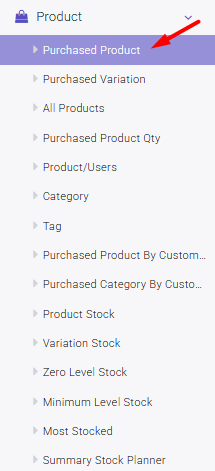
Step 3: Apply Date and other Filters
Open the Search/filter form by pressing Search icon.
Locate Date fields to enter a date range ( “From” and “To” dates). Enter the specific period you want to analyze.
Click the “Search” button to generate the report.
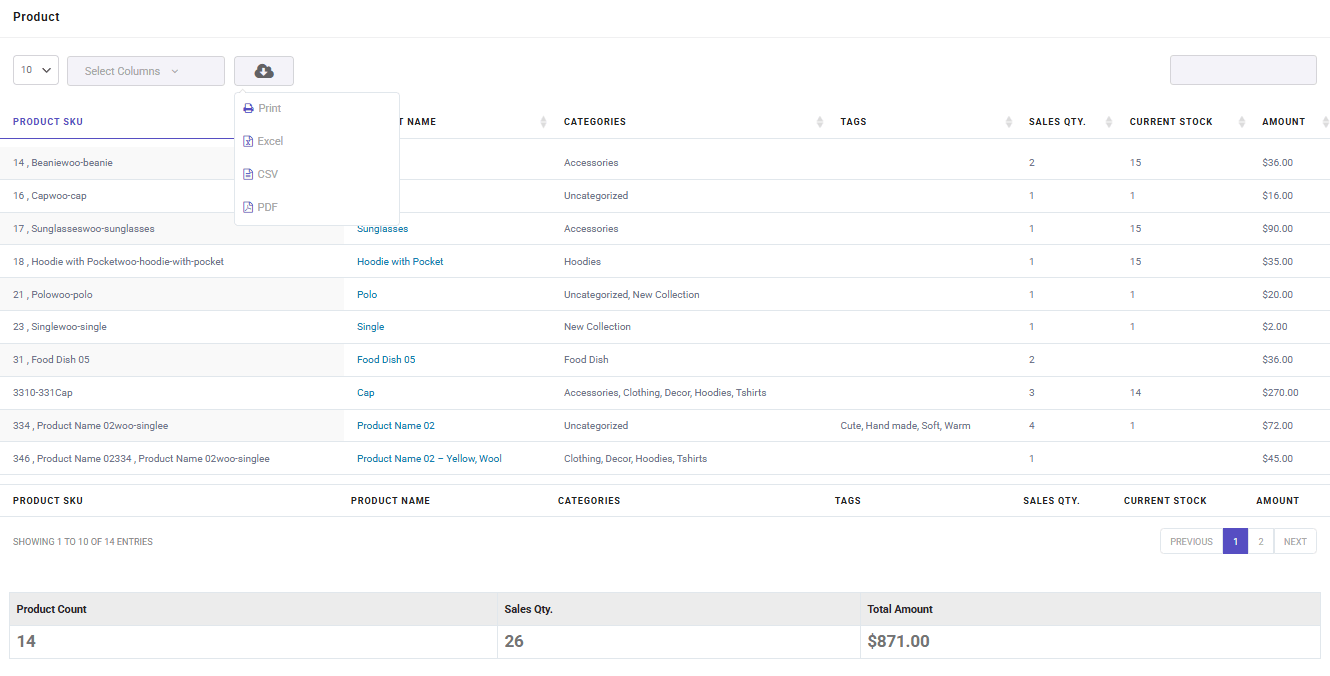
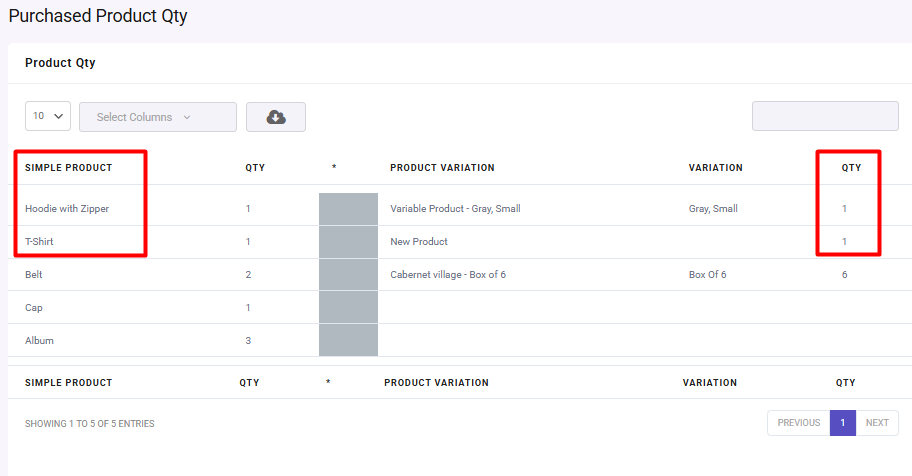
The plugin will generate a detailed report listing all products purchased within your specified date range.
The report includes following sales data:
- Product SKU: The unique identifier for each product. Essential for inventory management.
- Product Name: The name of the product.
- Categories: The product category/categories. This helps you identify which product categories are your top performers.
- Tags: Product tags can provide additional context for sales trends.
- Sales Qty.: The total number of units sold. This is the primary metric for identifying best-sellers.
- Current Stock: The remaining inventory level for each product. This is crucial for combining sales data with stock management to prevent stockouts on popular items.
- Amount: The total revenue generated by each product.
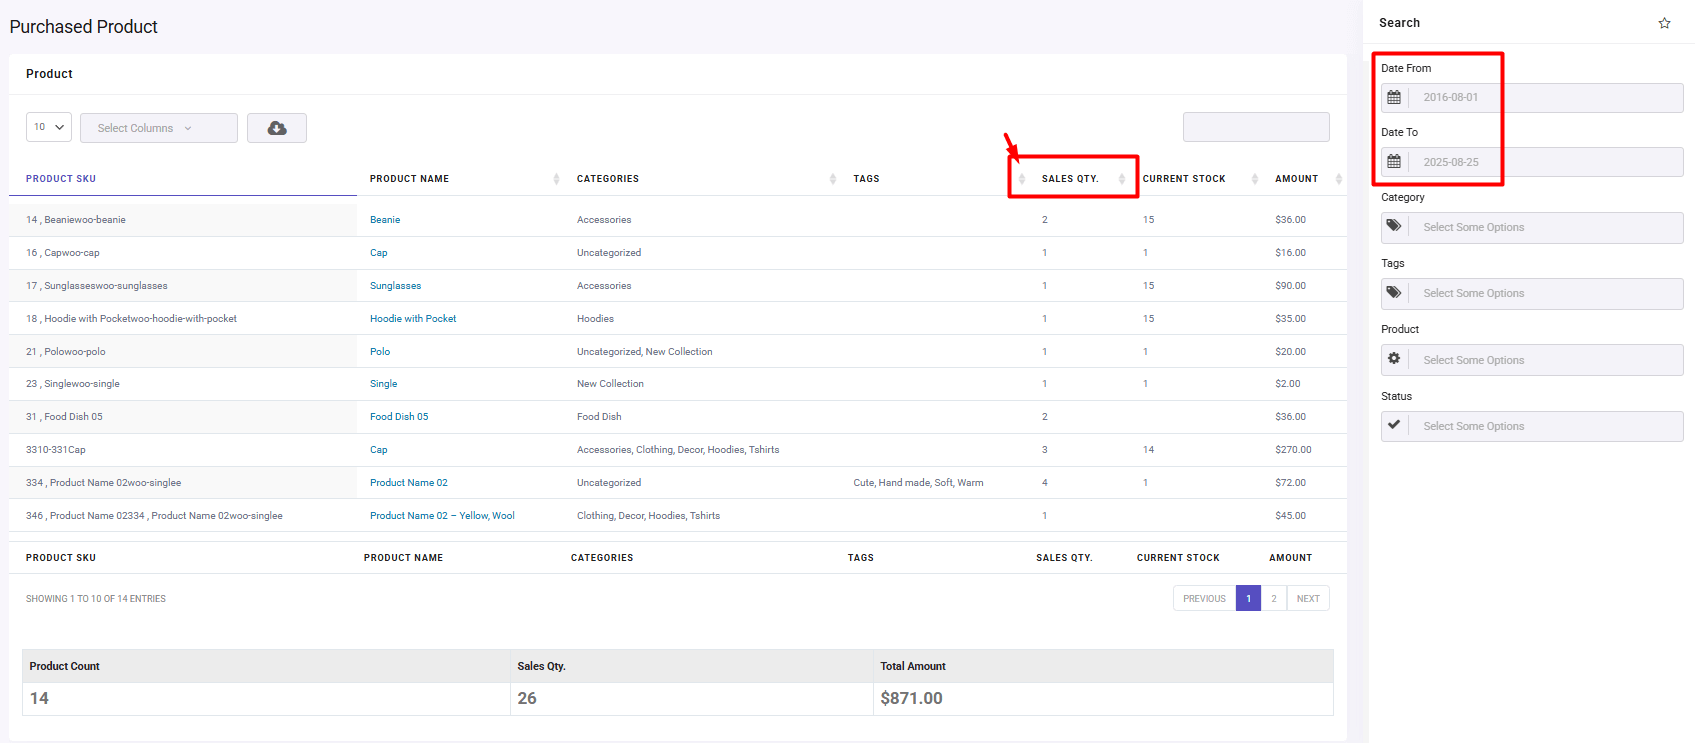
Step 4: Sort the Data to Identify Best-selling products and Underperforming products
Find the column labeled “Qty” (Quantity), which shows the number of units sold for each product.
Click the Sort icon (the up/down arrow) in the header of the “Qty” column to sort the products from highest to lowest quantity sold. This immediately reveals your best-selling products and Underperforming products.
REPORTiT – Advanced WooCommerce Reporting
The easy way to analyze data and find best & worst sellers in WooCommerce
How to Analyze Sales Data to Identify Best-Selling Products
Here is a structured approach for Sales Data analysis to Identify Best-Selling Products:
Step 1: Define Your Goal and Timeframe
The first step in effective sales data analysis is to define a specific timeframe, such as the last quarter or year-to-date. It is crucial for a focused and accurate product performance analysis.
Step 2: Gather the Required Data
Compile the necessary data from Product Sales Report including:
- Product Name/SKU,
- Quantity Sold,
- Total Revenue,
- and Date of Sale.
Step 3: Export the data to CSV file
To export Product performance analysis to CSV file, just click on the Download button on top of the table and choose your preferred format:
Step 4: Using Analytical Tools (Excel, Google Data Studio, BI Tools)
Moving beyond guesswork, these tools transform raw numbers into actionable intelligence, enabling a deep and efficient product performance analysis. They empower businesses to automatically identify best-selling products, pinpoint Underperforming products, and understand the underlying reasons for their performance, all through comprehensive sales data analysis.
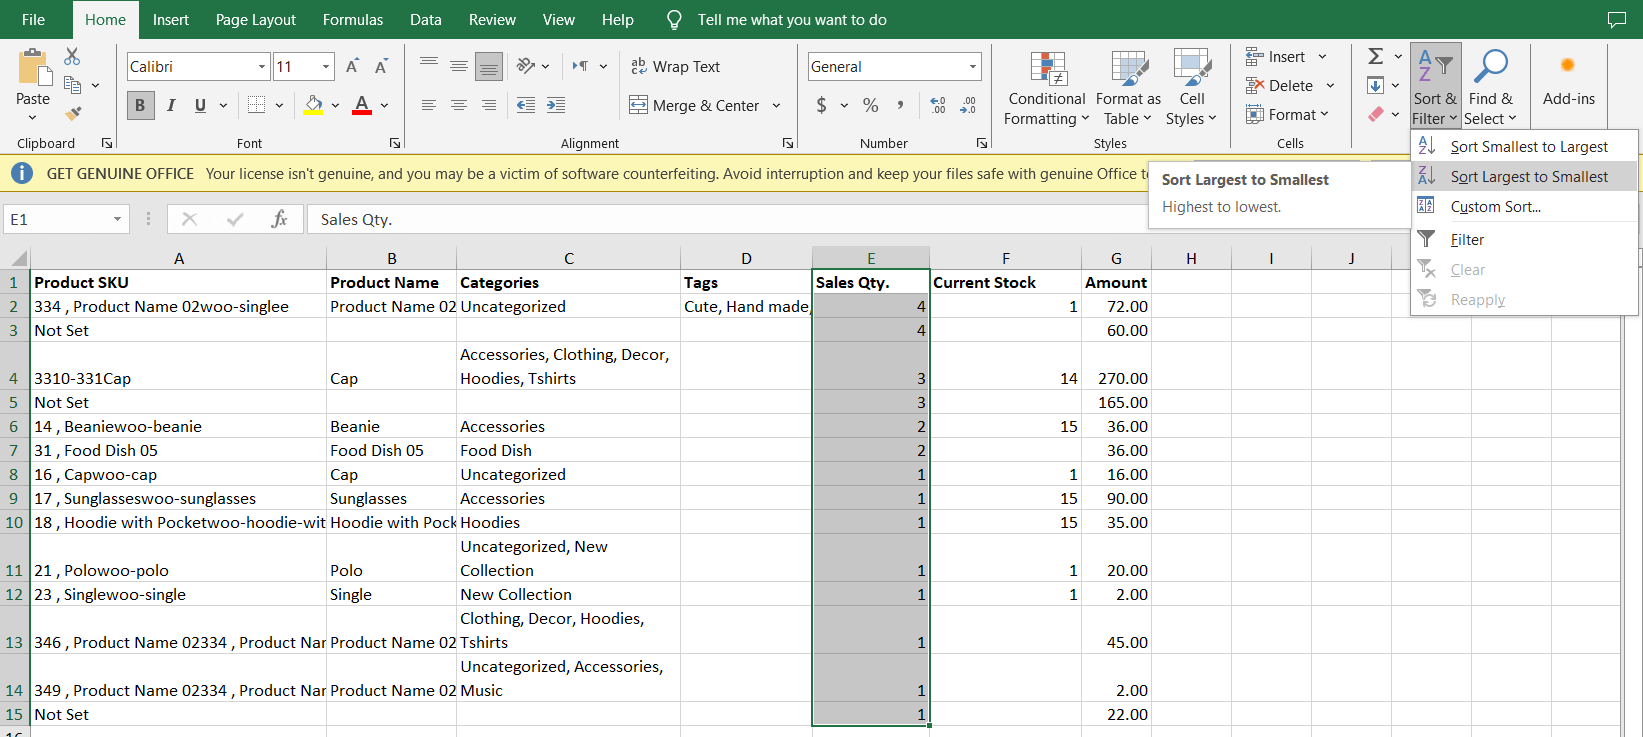
Microsoft Excel / Google Sheets
The most efficient method for analyzing Best-selling products is using a Pivot Table in Excel or Google Sheets. This powerful tool allows you to quickly summarize large datasets, making it easy to compare and contrast the performance of all your products without complex formulas.
You can manually sort through data to categorize best-selling products based on units sold or revenue and flag Underperforming products for review. This hands-on approach is ideal for smaller datasets and provides a crucial grounding in the principles of product performance analysis before scaling to more complex systems.
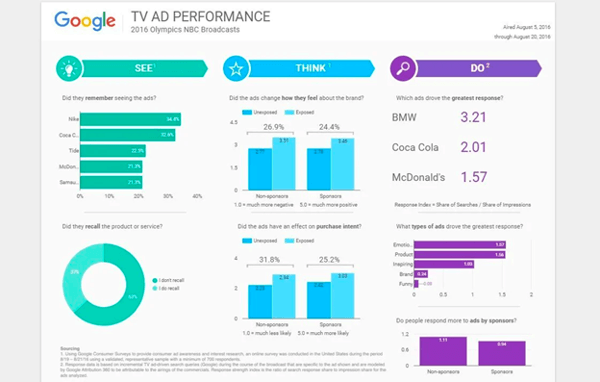
Google Data Studio (Now Looker Studio)
This tool elevates sales data analysis by turning your spreadsheets into interactive, easy-to-understand dashboards.
Using this handy tool, you can create:
- visual reports that automatically update,
- showing trends over time for your best-selling products
- providing at-a-glance insights into Underperforming products.
Its strength lies in its ability to visualize product performance analysis clearly and share it across teams, making data accessible to everyone.
BI Tools (Power BI, Tableau)
For enterprise-level sales data analysis, dedicated Business Intelligence (BI) tools like Power BI and Tableau are the gold standard.
In addition to providing vast amounts of data from multiple sources, it helps you to use powerful processing to uncover complex patterns and predictive insights.
These platforms comes with a holistic view of product performance analysis, offering advanced drill-down capabilities to understand not just what your best-selling products are, but precisely why they are successful and how to replicate that success, while also diagnosing the root causes of Underperforming products.
WooCommerce report plugin
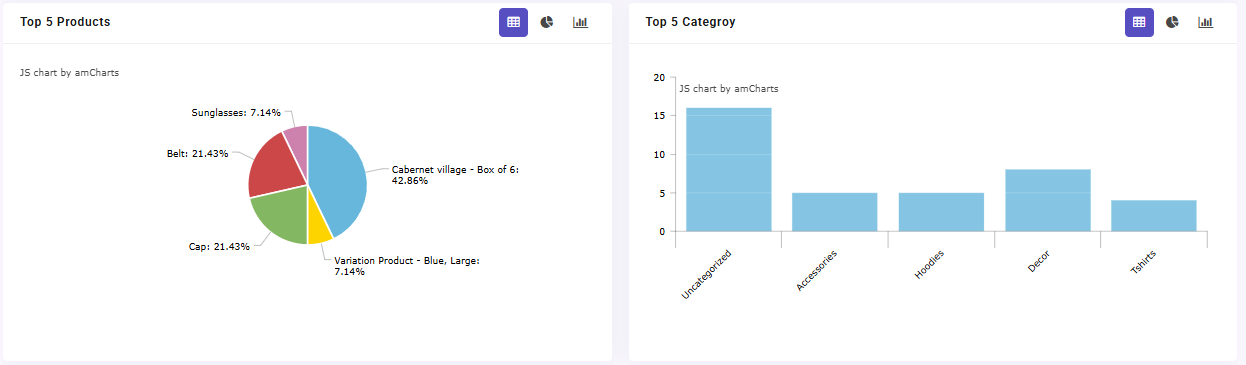
Creating a simple bar chart to visualize the top 10 products makes the results of your sales data analysis instantly understandable. This is an excellent way to communicate the findings to your team for highlighting the clear winners.
In the WooCommerce report plugin dashboard, you can easily review this report instantly:
Identifying Underperforming Products and Reasons for Poor Performance
Identifying Underperforming products is a critical component of a complete sales data analysis strategy. While finding best-selling products is about maximizing opportunities, pinpointing underperformers is about mitigating losses, optimizing inventory allocation, and uncovering valuable insights that can strengthen your entire product assortment. Valuable product performance analysis helps you to understand the reasons of low sales for underperforming products.
The process typically begins by filtering your sales reports by the “Quantity Sold” column in ascending order. In this way, you can immediately recognize the products with the fewest number of units sold within a given period.
However, to get a deeper insight, it’s essential to evaluate “Total Revenue” and, most importantly, “Profit Margin.” A product might have decent sales volume but generate minimal profit due to high costs or frequent discounts, making it a financial underperformer.
Once identified, diagnosing the reasons for poor performance is crucial. Common causes include:
- Pricing Issues: The product may be priced too high compared to its perceived value or competitors, or too low, which can devalue the brand and erode profits.
- Poor Visibility: The product might be buried on your website, have poor-quality images, an unclear title, or a weak description, making it hard for customers to find and understand.
- Inadequate Marketing: Unlike best-selling products that are often promoted heavily, low sellers may not be featured in marketing campaigns, email newsletters, or social media posts.
- Negative Customer Feedback: Bad reviews, low ratings, or a high return rate can significantly deter potential buyers and sink a product’s performance.
- Market Fit or Value Proposition: The product itself may not meet a real customer need, may be of inferior quality, or may be outdated by newer trends or technologies.
- Inventory and Availability: If a product is frequently out of stock, it trains customers to look elsewhere, killing its sales momentum.
Utilizing Trend Analysis and Customer Purchase Patterns
Utilizing Trend Analysis and Customer Purchase Patterns is the advanced application of sales data analysis that moves beyond static reporting to predict future outcomes and understand the “reasons” behind the numbers.
In WooCommerce report plugin, you can generate customer report with one click by navigating to Customer > Customer report.
As soon as specifying the date range and pressing Search button, you can see the customer purchase report:
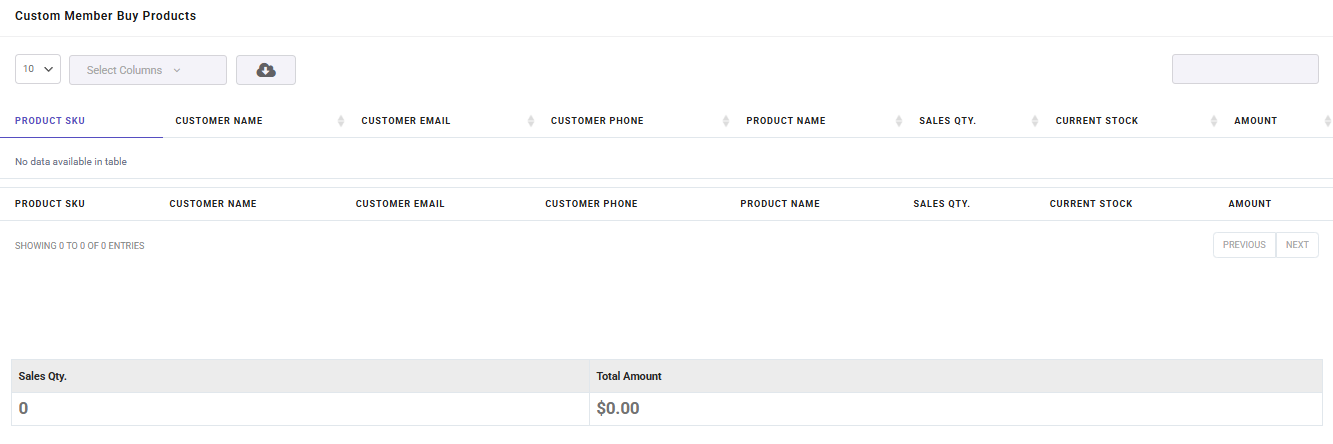
The details provided in this report allows you to precisely Analyzing Customer Purchase Patterns such as:
- Purchase History: What items are frequently bought together (market basket analysis)?
- Buying Cycles: How often do customers make a purchase?
By understanding these patterns, a business can move from reactive to predictive. For example, if data shows that customers who buy a specific best-selling product often purchase a particular Underperforming product within two weeks, a targeted email campaign can be created to cross-sell that item, effectively boosting its performance. This level of insight transforms sales data analysis from a simple reporting tool into a strategic engine for growth, customer retention, and inventory optimization.
The Role of Market Segmentation and Customer Group Analysis in Better Understanding Sales Data
Market segmentation and customer group analysis play an undeniable role in refining sales data analysis. Categorizing customers based on user role can uncover patterns that aggregate data might obscure.
To generate customer group report, easily open Customer Role/ Group menu and generate the following reports:
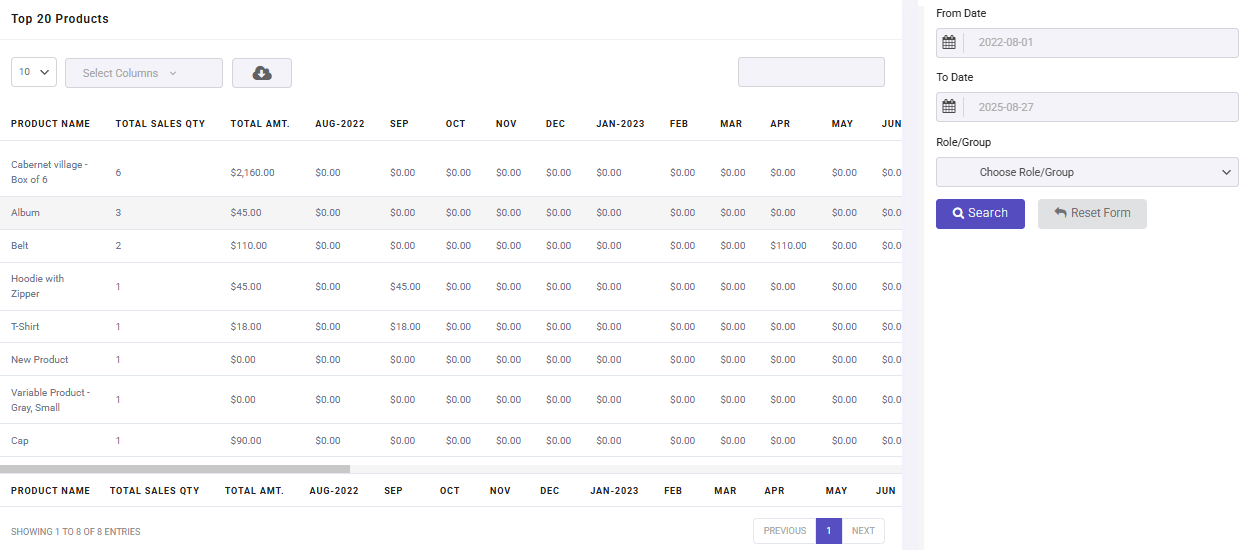
Top 20 products
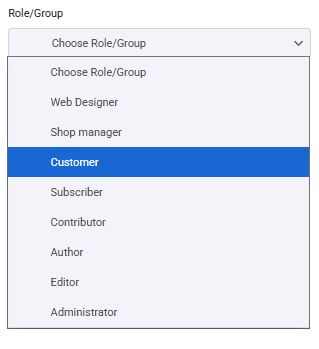
To generate this report, first set the date range then set the Role/Group filter as follows:
By generating the report, you can find the Top 20 products ordered by the filtered group:
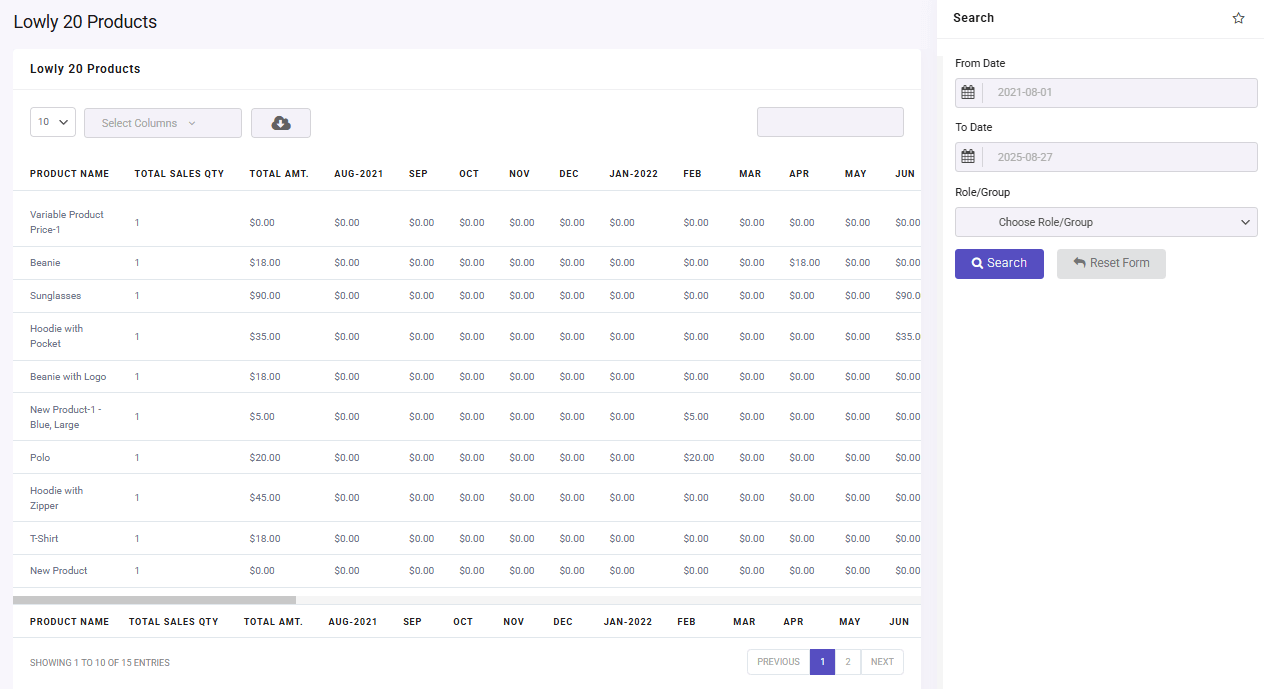
Lowly 30 products
You can generate same report for the lowly 30 products:
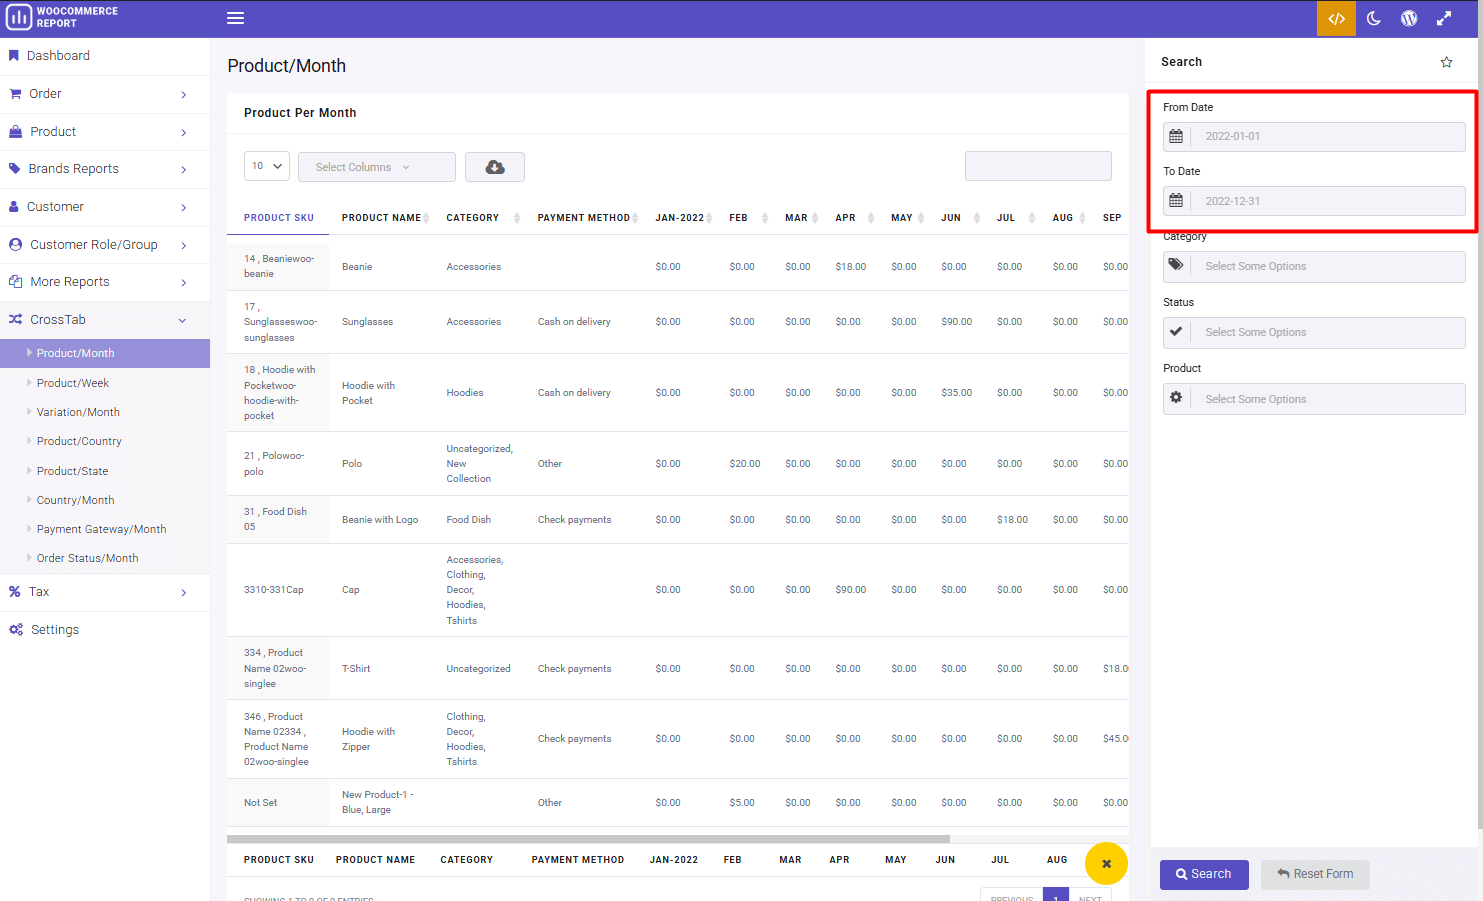
The Impact of Seasons and Timing on Product Sales
Seasons and timing significantly influence product sales, making temporal analysis a critical aspect of sales data analysis. For example, seasonal items like winter coats or summer swimwear exhibit clear peaks during relevant months, while holidays and events can drive demand for specific products.
By analyzing historical sales data, you can prevent stockouts of best-selling products during high-demand periods and try to clear out Underperforming seasonal items through timely discounts or giveaway campaigns, minimizing excess inventory and maximizing revenue.
In the WooCommerce Report Plugin, you can simply open the Cross tab menu and generate Product/month, or Product/Week reports with one click.
Using Analysis Results in Business Decision-Making (Changing Pricing Strategy, Advertising, Product Positioning)
The ultimate goal of sales data analysis is to translate insights into decisive action. A thorough product performance analysis provides the empirical evidence needed to move from guesswork to strategic business decisions.
Here’s how to use these insights across key areas:
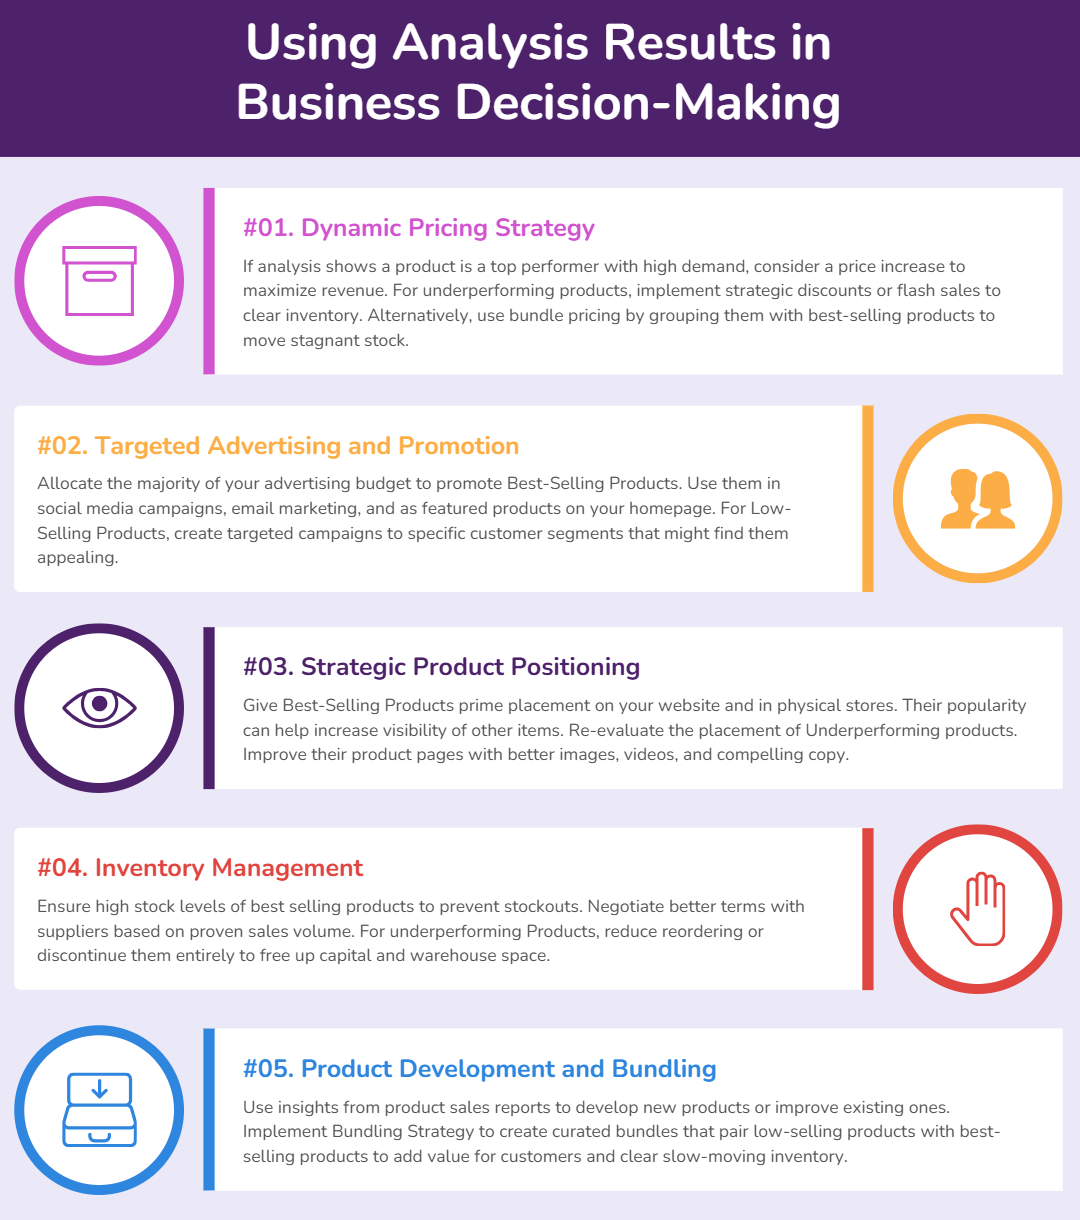
1. Dynamic Pricing Strategy
If analysis shows a product is a top performer with high demand and low price sensitivity, consider a slight price increase to maximize revenue. Alternatively, you can use them as loss leaders to attract customers.
For underperforming products, you can implement strategic discounts or flash sales to clear inventory. Alternatively, use bundle pricing by grouping them with a best-selling product to add value and move stagnant stock.
2. Targeted Advertising and Promotion
Allocate the majority of your advertising budget to promote Best-Selling Products. Use them in social media campaigns, email marketing, and as featured products on your homepage to drive traffic and conversions.
For Low-Selling Products, you need to create targeted campaigns to specific customer segments that might find them appealing.
3. Strategic Product Positioning and Placement
Give Best-Selling Products prime placement on your website (homepage, category page banners) and in physical stores (end-caps, checkout aisles). Their popularity can help increase the visibility of other items.
On the other hand, Re-evaluate the placement of Underperforming products on your site. Improve their product pages with better images, videos, and compelling copy. Consider make some internal links from the product pages of popular, related items.
4. Inventory Management and Assortment Planning
Ensure high stock levels of best selling products to prevent stockouts, which directly lead to lost sales. Negotiate better terms with suppliers based on their proven sales volume.
For underperforming Products, it is better to drastically reduce reordering or discontinue them entirely. This frees up capital and warehouse space to invest in and test new products that have the potential to become future best-selling products.
5. Product Development and Bundling
Use the insight of Analyzing product sales report (e.g., specific features, price point, design) to develop new products or improve existing ones.
Implement Bundling Strategy to Create curated bundles that pair a low-selling product with a best-selling product. This adds value for the customer and helps clear out slow-moving inventory without resorting to deep discounts that hurt brand perception.
Read More: What is Woocommerce Cross-sell, Setting Up WooCommerce Product Cross-Sells (With & Without Plugins)
Practical Example: Analyzing Sales Data of a Hypothetical Store
Consider a hypothetical online fashion store, “StyleHub.” By conducting a sales data analysis, StyleHub identifies that its best-selling products are minimalist dresses and athletic wear, while Underperforming items include formal suits.
Using a product performance analysis, the team discovers that suits have a high bounce rate on product pages. Further investigation reveals that customers find the suits overpriced compared to competitors.
Based on these insights, StyleHub decides to reposition the suits as premium items with enhanced marketing, bundle them with popular accessories, and offer limited-time free gift. This data-driven approach helps improve sales of underperforming products while leveraging top sellers.
Common Challenges and Mistakes in Sales Data Analysis
Despite its importance, sales data analysis often faces challenges such as data silos, poor data quality, and misinterpretation of metrics.
For example, focusing solely on sales volume without considering profitability can lead to misguided strategies, as some best-selling products may have low margins.
Additionally, overlooking external factors like economic trends or competitor actions can skew analysis.
To avoid these pitfalls, businesses must ensure data accuracy, integrate multiple data sources, and contextualize findings within broader market conditions. Embracing a holistic approach mitigates risks and enhances the reliability of insights.
Conclusion and Practical Recommendations for Businesses
Sales data analysis is indispensable for identifying best-selling and Underperforming products, optimizing operations, and driving informed decision-making. To leverage its full potential, businesses should:
- Regularly conduct product performance analysis to track trends and patterns.
- Segment customers to uncover hidden opportunities and tailor strategies.
- Align inventory and marketing efforts with seasonal demand.
- Use tools like WooCommerce report plugin, BI platforms, or e-commerce analytics for efficient analysis.
- Avoid common mistakes by validating data quality and considering external factors.
By adopting these practices, businesses can transform raw data into actionable strategies, ensuring sustained growth and competitiveness.
REPORTiT – Advanced WooCommerce Reporting
The easy way to analyze data and find best & worst sellers in WooCommerce
FAQ
Q: How can best-selling and Underperforming products be identified?
A: By collecting sales data, analyzing key performance indicators (KPIs) such as sales volume, revenue, and profitability, and using analytical tools, you can identify best-selling and Underperforming products.
Q: Which data is important for analyzing product sales?
A: Data such as quantity of sold items, revenue, profit, returned items, customer feedback, and sales date are important for analyzing product sales.
Q: What tools are recommended for sales data analysis?
A: Tools like WooCommerce report plugin, Microsoft Excel, Google Sheets, Google Data Studio, Tableau, Power BI, and dedicated store software can assist with sales data analysis, allowing businesses to create interactive dashboards that visually highlight best-selling products and immediately flag Underperforming products through trends and alerts.
Q: How does sales data analysis help a business?
A: The ultimate goal of sales data analysis is to inform strategy. By understanding your product performance analysis, you can confidently allocate your budget towards promoting top sellers, decide on discount strategies for slow-moving inventory, and make data-driven decisions about production and stock levels to optimize profitability.
Q: What strategies exist to improve the sales of Underperforming products?
- Identifying a Underperforming product is only the first step. The next is a targeted action plan informed by your sales data analysis. This could involve evaluating pricing, bundling them with best-selling products, repositioning them to a different customer segment, or using insights from customer feedback to make improvements that revitalize the product’s market appeal.


