
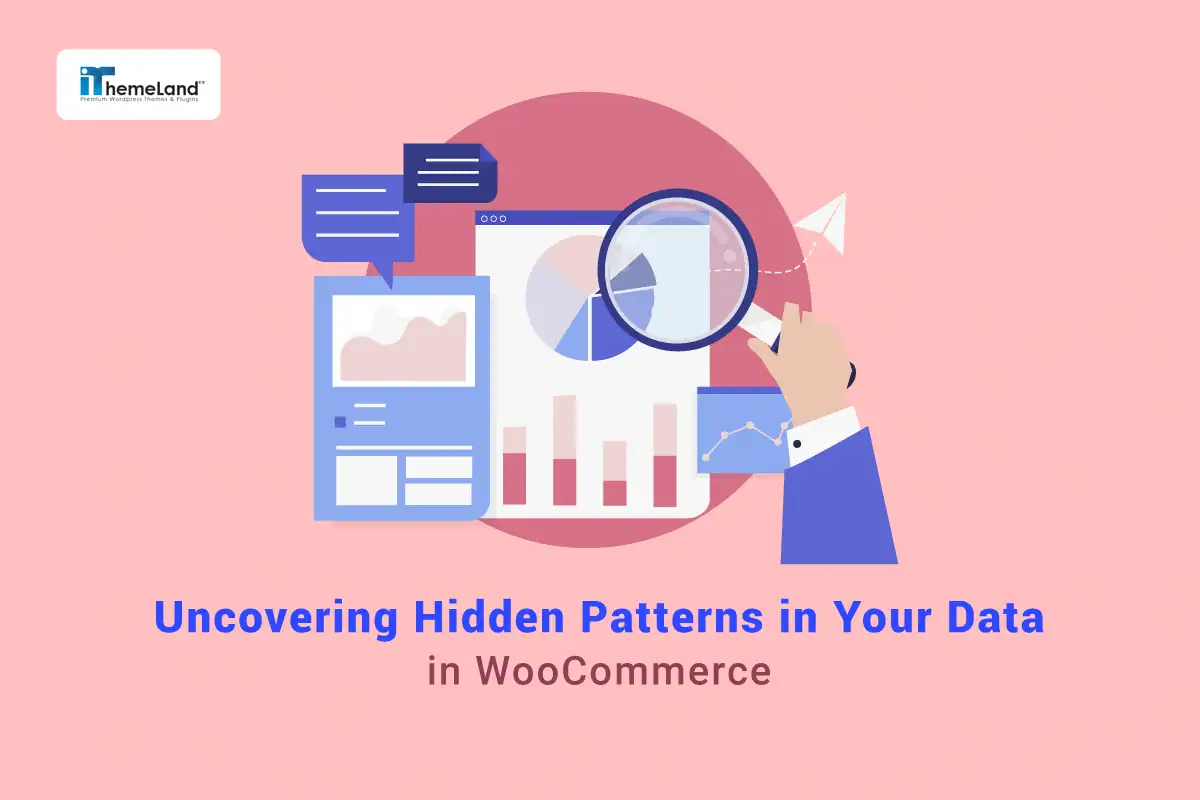

The researches performed by Deloitte’s about modern retail KPIs and further analysis in Forbes’ on the need for new retail metrics revealed that focusing solely on top-line sales figures can cause retailers to overlook a significant portion of actionable WooCommerce insights embedded within in-store behavior and performance metrics.
This untapped potential lies in uncovering hidden patterns in WooCommerce data related to customer journeys, product affinities, and behavioral trends by employing advanced WooCommerce analytics. It can transform raw numbers into a strategic map, revealing the ecommerce hidden trends that dictate customer loyalty, product success, and marketing efficiency.
Why Go Beyond Sales Metrics?
Most of store managers rely on common sales metrics like total revenue and order count to make data driven decisions, but they ignore advanced WooCommerce analytics to uncover ecommerce hidden trends. The result is unsuccessful attempts to move the business forward.
If you want to really make progress on your business, you need to dig into the hidden patterns in WooCommerce data:
- Which customer segments drove the growth?
- Which marketing channels brought the most profitable buyers?
- Did a price change on a flagship product affect the sales of complementary items?
By moving beyond sales metrics, you unlock the ability to predict future performance which is important for optimizing every customer touch point, and identifying operational inefficiencies before they impact your bottom line.
Types of Hidden Patterns in WooCommerce Data
WooCommerce data analysis holds several categories of ecommerce hidden trends. The most important types of Hidden patterns in WooCommerce data are:
- Date patterns: The advanced WooCommerce analytics of sales reports must go beyond simple seasonality to include the targeted date range. For example, after running a specific promotion or revealing the pattern with the highest average order value, or product sales spike.
- Customer behaviour patterns: Behavioral Patterns reveal the performance of different customer segments; for instance, sales patterns of new customers vs repeat buyers, or returning customers data that is helpful for making smarter decisions to improve customer loyalty.
- Product Relationship Patterns: ecommerce hidden trends in product reports include the analysis of which products are frequently purchased together (cross-selling opportunities) or which products, when viewed, lead to the abandonment of another (substitution effects).
- Customer Journey Patterns: These WooCommerce insights map the paths customers take from arrival to purchase, helping store managers to identify critical drop-off points in their funnel and the marketing sources that lead to the most valuable, long-term customers.
Advanced analysis requires cross-referencing these standard reports to uncover hidden patterns in WooCommerce data.
Let’s explore how you can analyze different types of Hidden Patterns in WooCommerce reports:
1. Uncover Misleading Campaigns & Product Issues
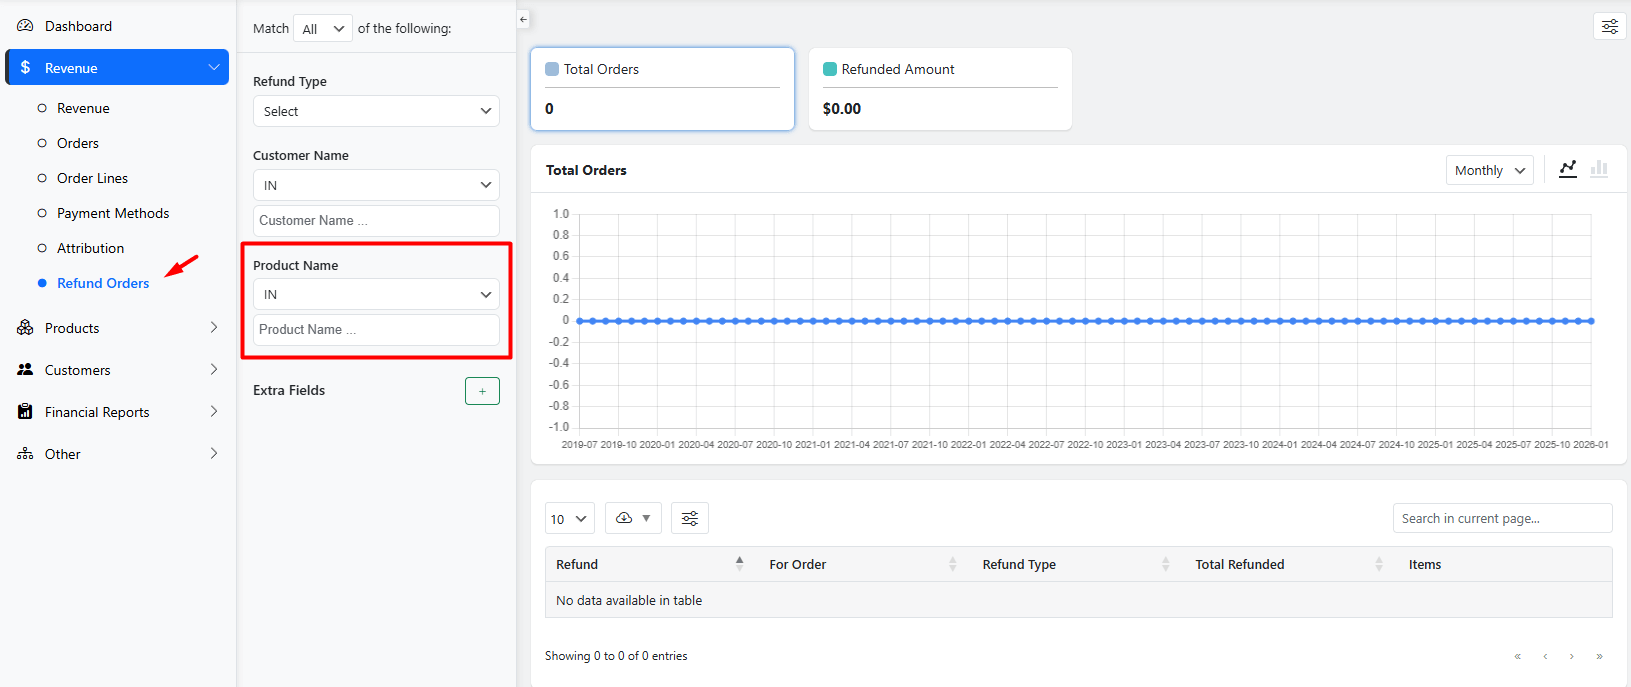
To uncover campaigns and products issues, you need to cross check Products and Refund Orders reports.
In the product report, don’t just look at top-selling products. Filter the products report by total sales or sort the purchased products based on the Net sales to show items with high sales volume.
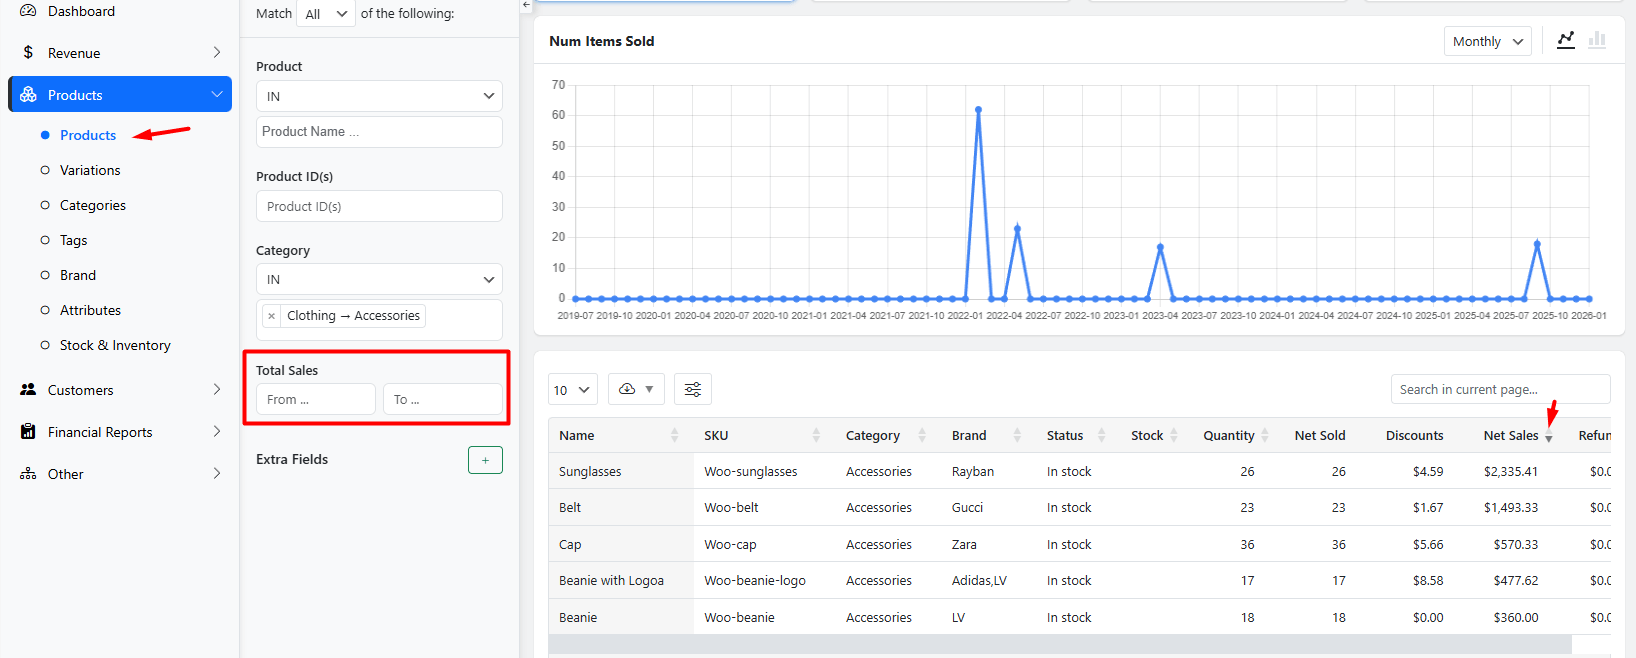
Then you can generate a refunded report and filter the result by the high-volume products. A product with a high return rate strongly indicates the problem in delivery or the quality of product.
How to Turn Data Patterns Into Actionable Ecommerce Strategies?
By cross-checking both reports, you can identify which high-demand products have issues and then take the necessary actions to ensure their quality or resolve logistics problems.
2. Segment High-Value vs. Low-Intent Customer Groups
In the Customer group report you can group customers by their “join date”.
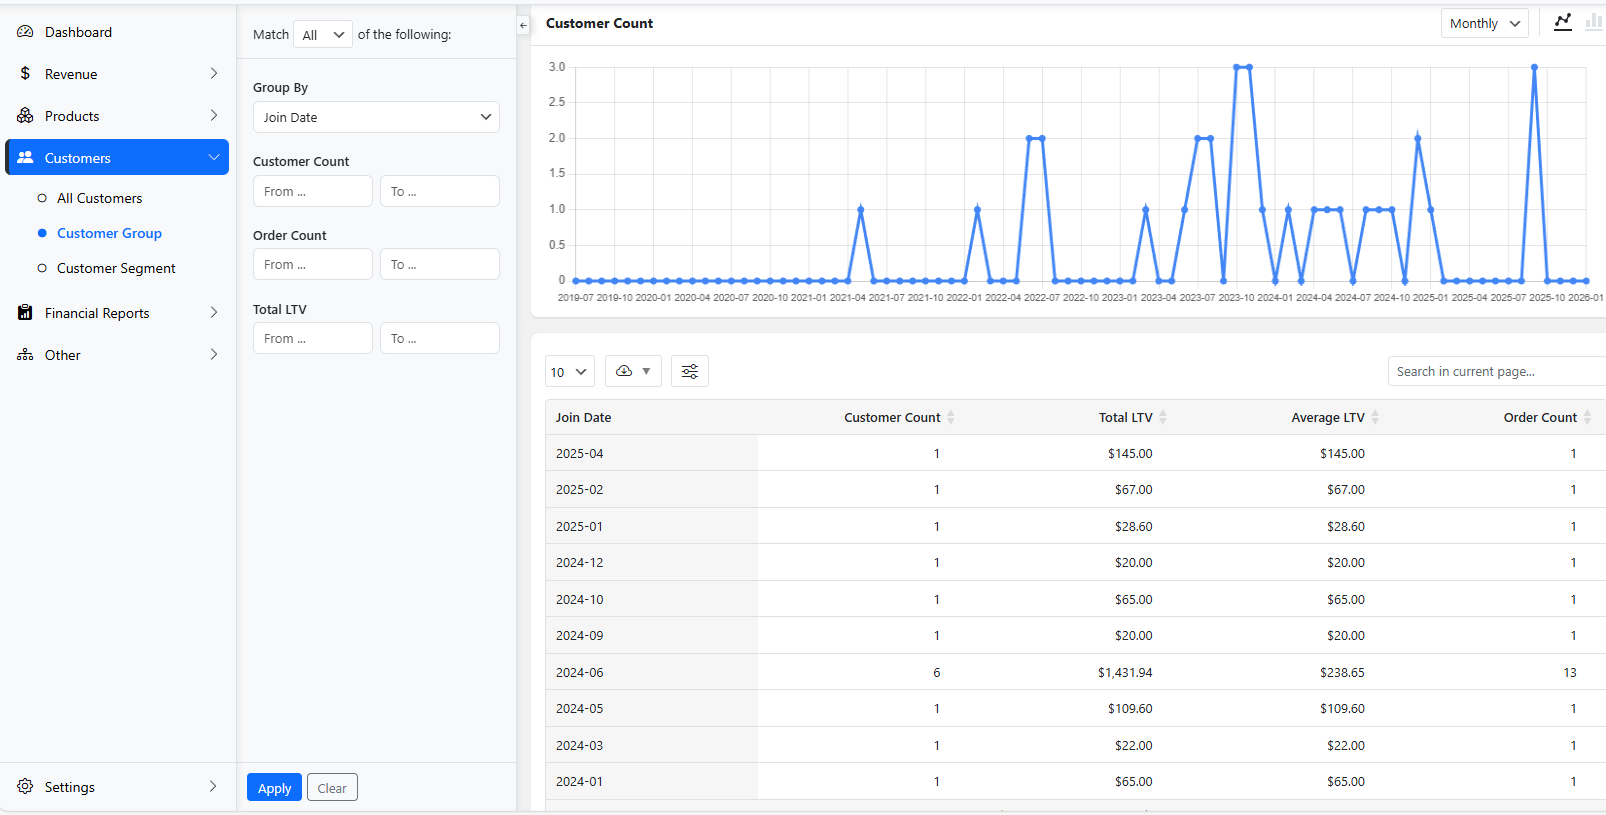
Then, use the Orders report to analyze which products each customer group buy on that time—do they start with low-value items and move to premium products?
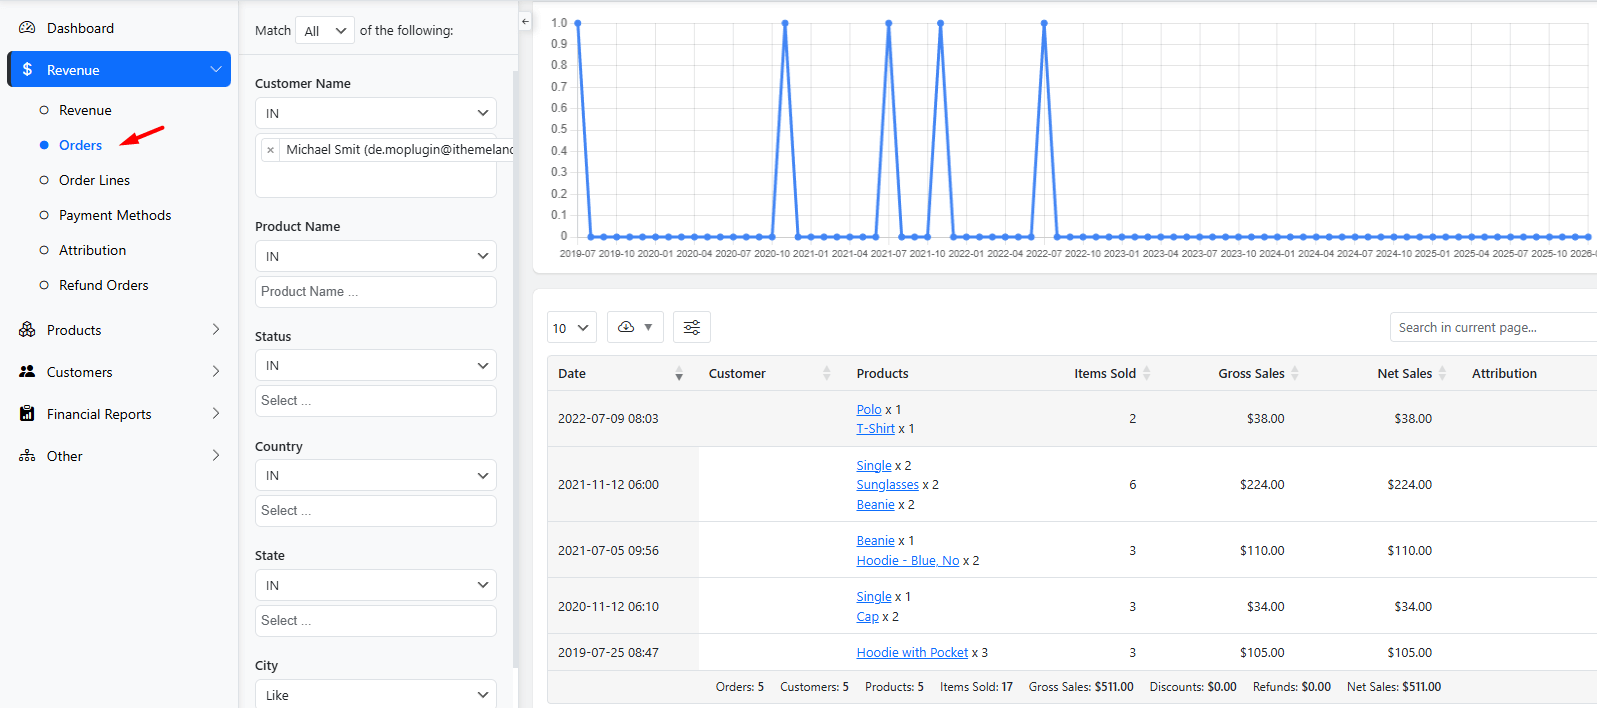
Finally, look at the Attribution report to see which acquisition channels bring in the most valuable orders.
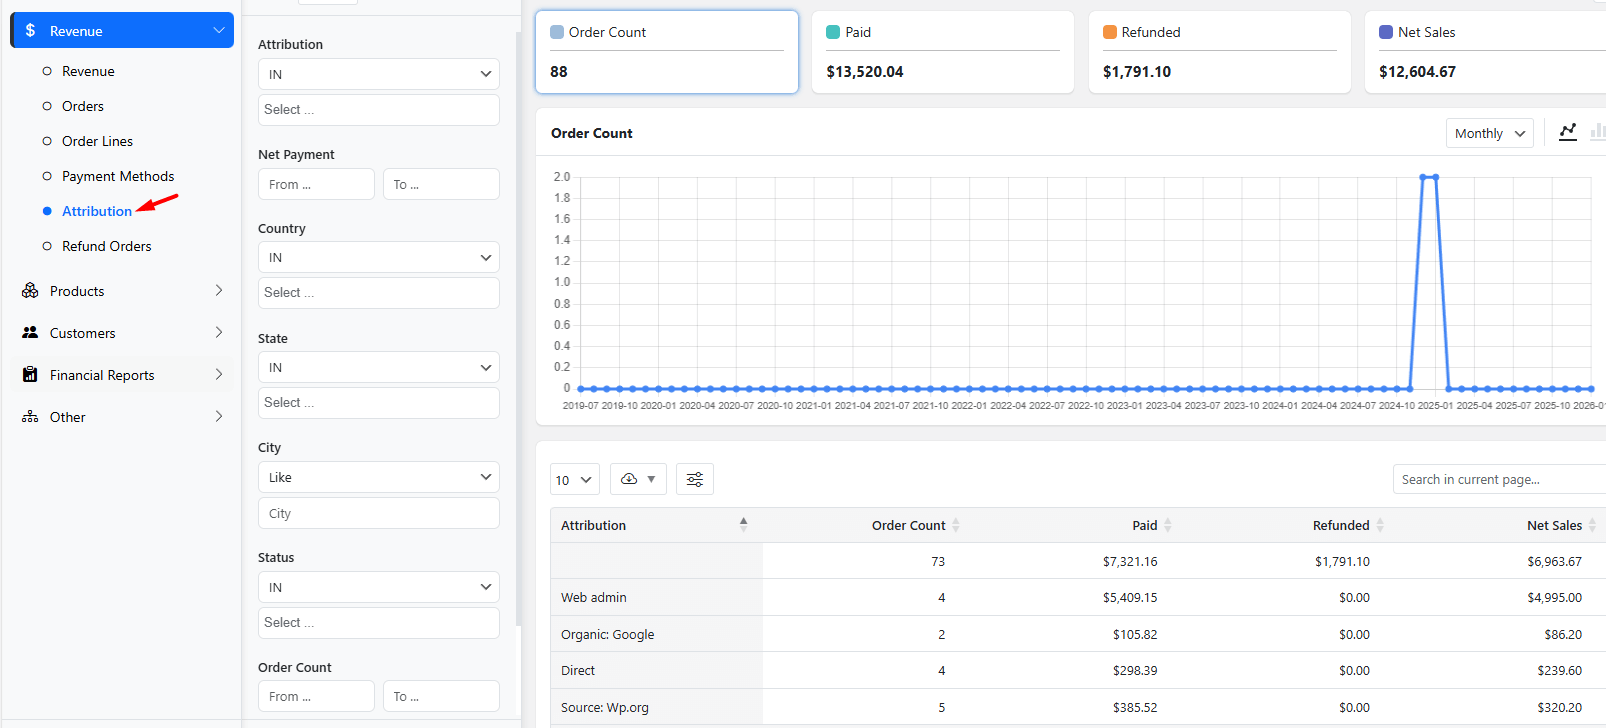
How to Turn Data Patterns Into Actionable Ecommerce Strategies?
Cross checking all data in these three reports reveals if your “brand awareness” campaign at a specific time can actually attract customers or encourage them to buy more from specific products.
3. Diagnose Cart Abandonment & Forecast Demand
True WooCommerce data analysis of cart abandonment looks at what is being abandoned, not just the rate. Regularly generate the Order Lines report and filter the result by On Hold orders to see which specific product variations (size, color) are most frequently left in carts.
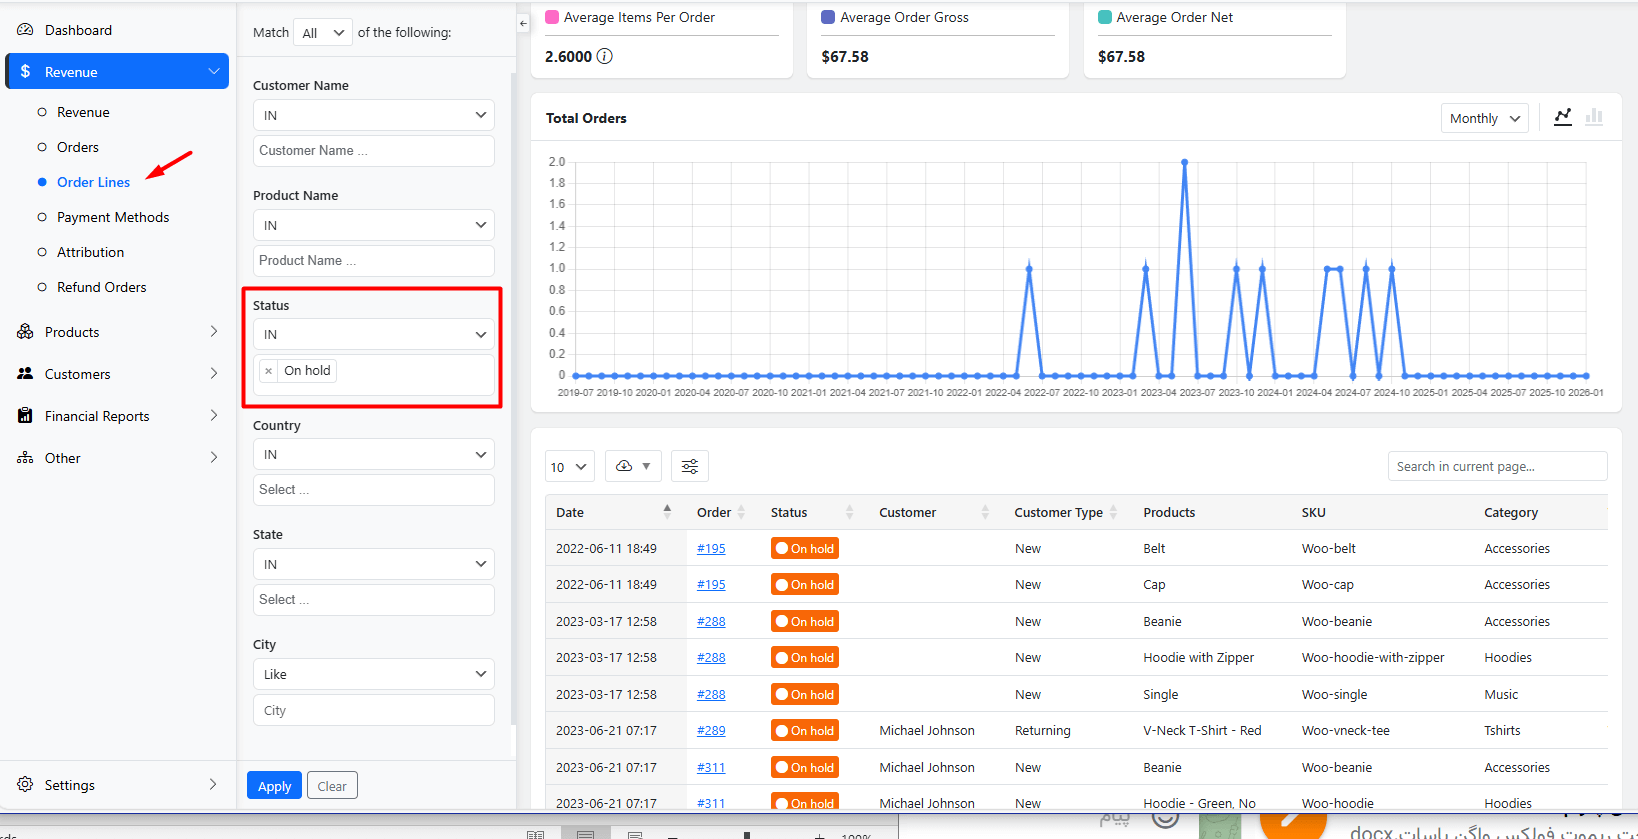
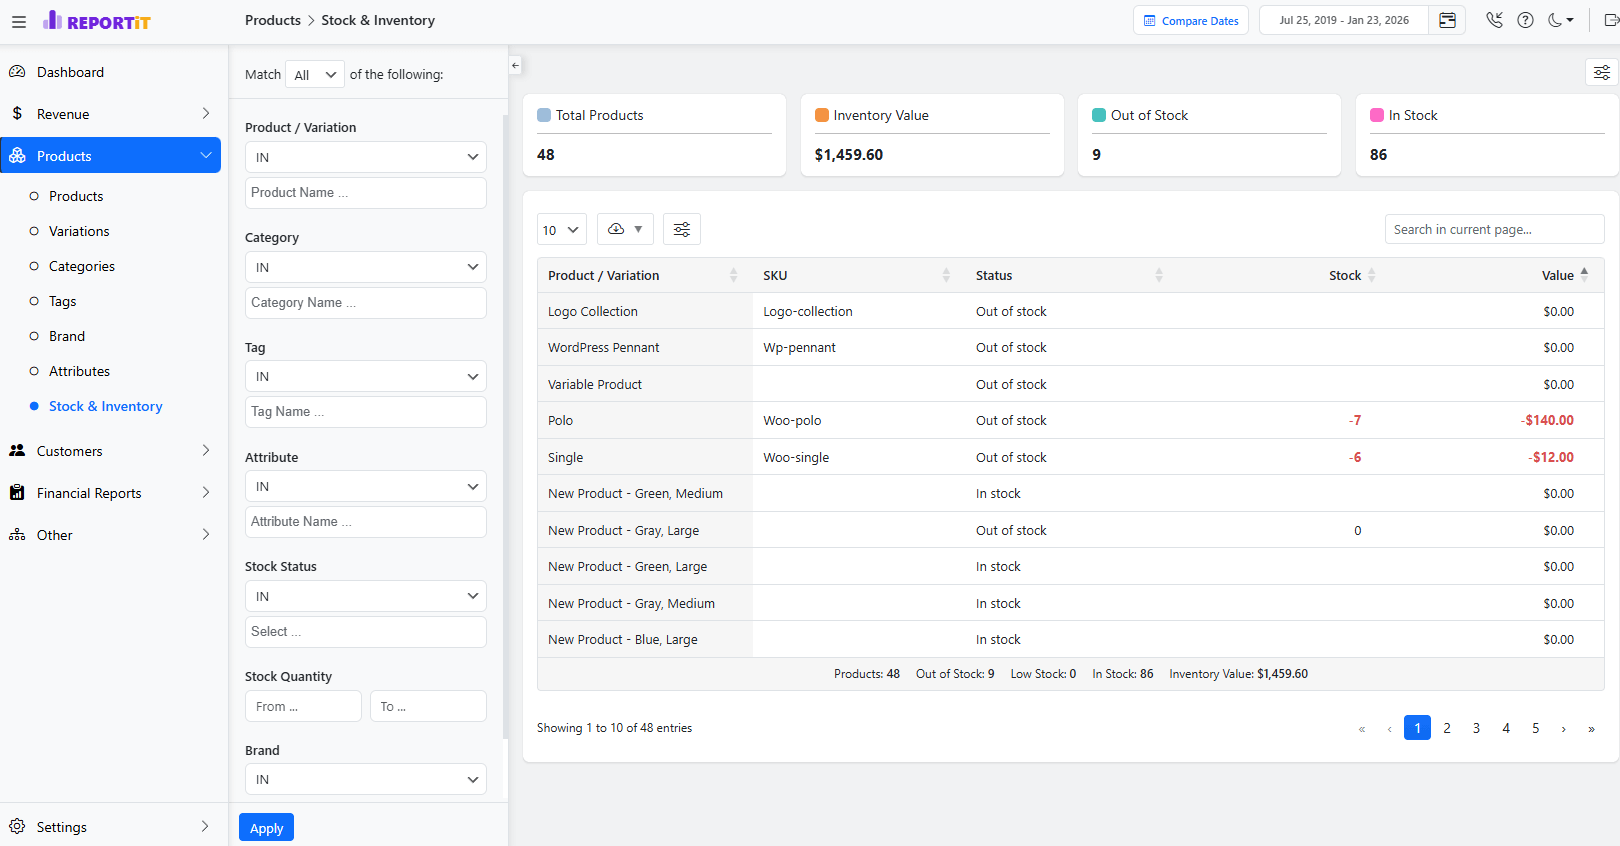
Cross-check this list with the Products stock report—are these the same items often low or out of stock? This hidden pattern in WooCommerce data points to abandonment due to availability anxiety.
REPORTiT – Advanced WooCommerce Reporting
The easy way to uncover hidden patterns in your data and optimize insights in WooCommerce.
Tools and Plugins for Advanced WooCommerce Data Analysis
WooCommerce native analytical tools provide a foundation for uncovering Hidden patterns in WooCommerce data. However, for deep insights about ecommerce hidden trends, you need an advanced WooCommerce analytics tool that keeps your data private and fully integrated.
REPORTiT as a complete on-site business intelligence suite allows you to generate incredibly detailed and customizable reports across every domain:
- Customers,
- Orders,
- Products,
- Revenue,
- Taxes,
- And custom segments.
Its modular, add-on-based architecture along with multi-layered filtering enable you to drill down into data by date, customer group, location, payment method, and countless other attributes to answer specific business questions.
It has a fully customizable dashboard, where you can add, remove, and arrange widgets to match your strategic priorities.
There is also a dedicated Forecast module, allowing you to input your predicted sales and customer targets for the upcoming year.
All of these amazing features makes it an exceptional tool for advanced WooCommerce analytics and identifying ecommerce hidden trends.
Step-by-Step Guide: How to Extract and Clean WooCommerce Data with REPORTiT plugin
The process of uncovering Hidden patterns in WooCommerce data is streamlined with REPORTiT – Advanced Reporting for WooCommerce plugin by following the steps below:
Step1: Installation and Activation:
- After purchasing, download the REPORTiT plugin ZIP file.
- Navigate to your WordPress Dashboard > Plugins > Add New, and upload the file.
- Click “Install Now” and then “Activate.”
To unlock all features, you will need to activate your license by going to iThemeland > License, entering your purchased key and email.
Step 2: Defining the Date Range with Presets or Calendar:
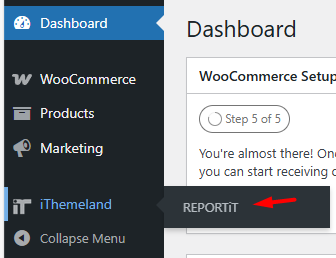
Once active, navigate to iThemeland > REPORTiT.
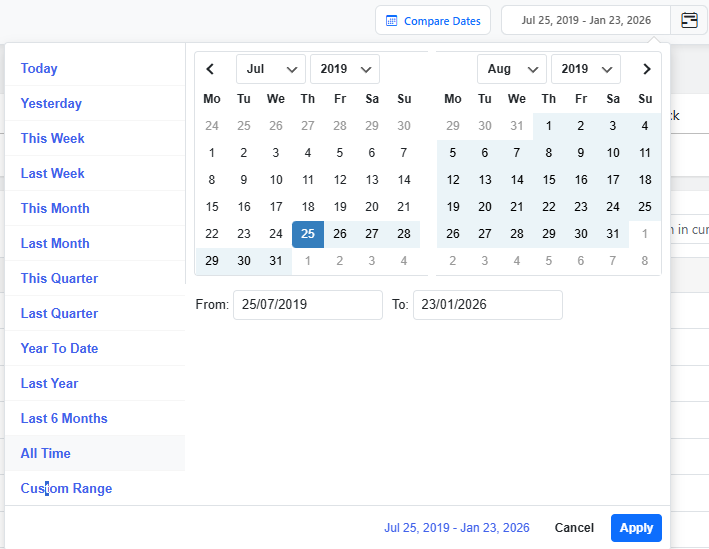
At the top of the main page, you will find the date filter options.
You can select from convenient presets like “Last Month,” “This Quarter,” or “Last 30 Days,” or use the built in calendar to define a custom range.
Step 3: Selecting the Desired Report (Customer, Product, Stock, Order, etc.)
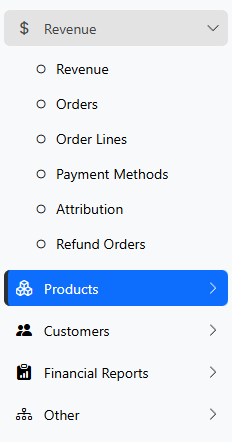
The main menu within the dashboard lists all available reports.
Open the items in the menu and click on one of them to generate the report you need.
The most useful WooCommerce reports are:
- Customer analysis,
- Product performance review,
- Stock report,
- Order detail list,
- Attribution report,
- Revenue summary,
- And more.
Customizing Visualization and Exporting Data:
Once the report is generated, you can see a highly interactive interface with customization options, including:
Filters:
There is a comprehensive filter form available for narrowing data in each report. You can set multiple filters like Order status, Products, Customers, and more to find the exact data needed for your performance analysis.
Chart Customization:
The visual chart is fully customizable by clicking on different metric cards (e.g., “Net Sales,” “Orders”) at the top of the report. It will dynamically change the main chart below to plot that metric’s trend.
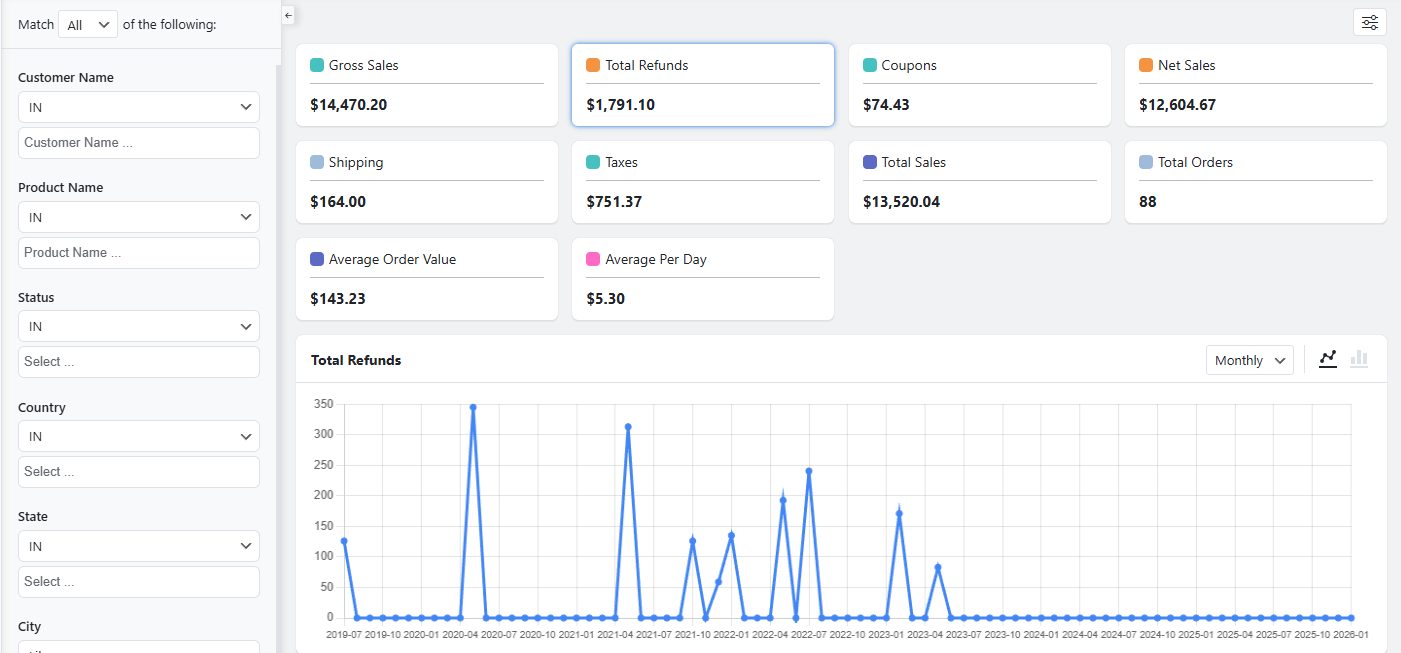
You can also switch the chart view between line (for trends) and bar (for comparisons) graphs and adjust the time granularity (e.g., by month or by year).
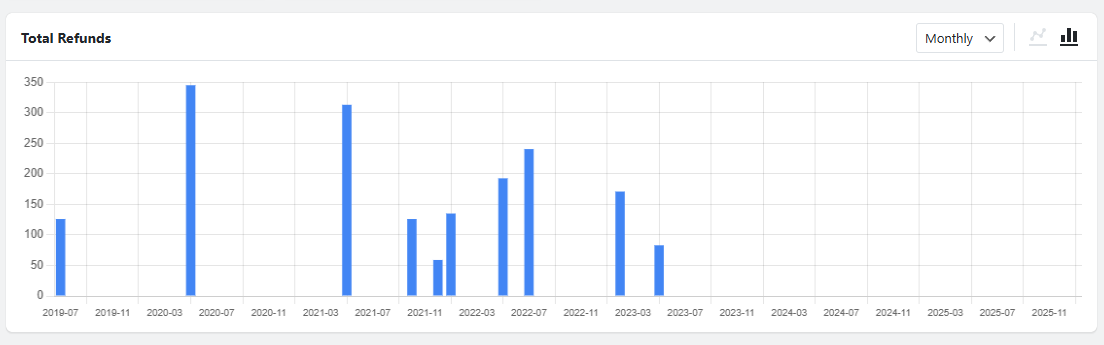
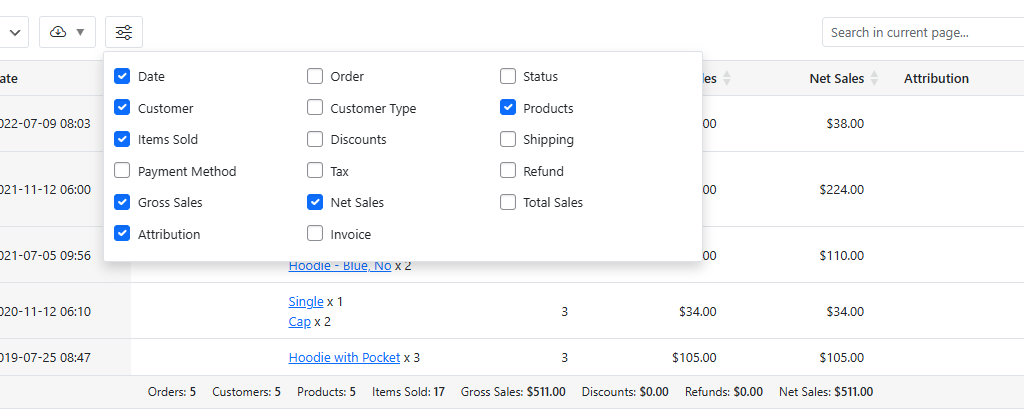
Table Customization:
The detailed table has customization options as well. The columns are fully editable using the Column Manager to show or hide specific data columns. You have also access to the search box to find specific products or customers.
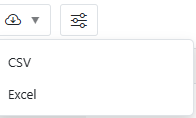
Download/Export report
Download/Export button is provided in the report to let you export the precisely filtered and customized dataset to CSV or Excel format.
Techniques for Data Exploration: Segmentation, Correlation, and Cohort Analysis
Once you have extracted required data from sales reports, it is very important to apply analytical techniques for exploration.
Here, you can find the most useful techniques in this regard:
Segmentation: Segmentation is a smart way for dividing customers and products into meaningful groups. The most common data about Customer segmentation are provided in the Customer segment report however, you can manually segment data by LTV, purchase frequency, geographic location, or acquisition source. For uncovering hidden patterns of product data, it is useful to segment the data by profitability, seasonality, or category.
Correlation Analysis: The Correlation technique is based on finding relationships between variables. For example, in Attribution report, you may notice that increasing blog traffic correlates with sales of specific tutorial-related products or based on Revenue report, a rise in Average Order Value (AOV) correlates with the offering of a specific shipping option or the promotion of a particular product bundle. Correlation doesn’t always mean causation, but it highlights promising areas for testing.
Cohort Analysis: In this technique you need to consider time-based segmentation. For instance, you can track the behavior and value of a specific customer group who signed up in the same month (a “cohort”) over their lifetime. This reveals whether the quality of your customers is improving over time and how long it takes for different cohorts to become profitable, moving beyond misleading averages.
Case Studies: Real Examples of Uncovered Patterns Driving Growth
Here, you can review two case examples with real, reputable data to realize how online stores use WooCommerce insights to uncover hidden patterns in WooCommerce data.
| Case Study | Scenario Summary | Supporting Real Data / Insight | Source |
|---|---|---|---|
| Case Study 1: The Unexpected Best-Seller Bundle | A home goods store identified a non-obvious product pairing and created a bundle (“Cozy Evening”), boosting sales of both products and raising AOV. | Ecommerce research shows that strategic product bundles can increase sales by ~20–30% and AOV by 20–30% because bundles encourage customers to buy more items together. | 33 Physical Product Bundling Statistics (2025) — Swell: strategic product bundling drives up to 30% sales and AOV improvements. Physical product bundling research and statistics for ecommerce 2025 |
| Case Study 2: The High-Value, Low-Attention Channel | An electronics retailer found that customers from a niche channel had significantly higher long-term value and lower returns than from major paid campaigns, prompting reallocation of ad spend. | Influencer marketing data shows that niche and micro-influencers often drive higher ROI and more valuable customer behavior (e.g., higher conversion rates and stronger sales outcomes) than broader ads — supporting why a niche YouTube channel could outperform mass paid social. | Ecommerce influencer ROI guide — Tomoson: influencer content leads to higher conversion rates and revenue impact compared to traditional ads. Ecommerce influencer marketing ROI research and metrics |
Challenges and Pitfalls in Data Pattern Analysis
The most Challenges and Pitfalls in WooCommerce data analysis is precise data extraction and finding a reliable tool.
During the analysis of ecommerce hidden trends, you have to aware of common obstacles:
- Analysis Paralysis: getting lost in overwhelming data with no effective action,
- Confirmation Bias: only looking for data that supports your hypothesis,
- Misinterpreting Correlation for Causation: assuming because two things trend together, one causes the other.
There is also some significant technical challenge that can render any analysis useless, including:
- Dirty Data—inconsistent product categorization,
- Duplicate customer records,
- Or improperly tracked refunds
Best Practices for Ongoing WooCommerce Data Monitoring
Define Your Core KPIs: Limit yourself to 5-7 key metrics that truly drive your business (e.g., Conversion Rate, Customer Acquisition Cost, LTV, Top Product Sell-Through Rate).
Create a Custom Dashboard: Use REPORTiT to build a dashboard that covers these KPIs at a glance. Avoid default dashboards cluttered with irrelevant info.
Schedule Regular Reviews: Schedule sending weekly report to check leading indicators and monthly report to analyze trends and patterns.
Foster a Test-and-Learn Culture: Every WooCommerce data analysis should lead to a hypothesis, which should lead to a test (e.g., an A/B test, a new targeted campaign). Data informs action, and the results of that action create new data.
REPORTiT – Advanced WooCommerce Reporting
The easy way to uncover hidden patterns in your data and optimize insights in WooCommerce.
Conclusion: Building a Data-Driven WooCommerce Store
Uncovering the hidden patterns in WooCommerce data is not a one-time project; it is the foundational practice of a modern, competitive ecommerce business. By moving beyond vanity sales metrics, leveraging ReportiT as a powerful solution for advanced WooCommerce analytics, and applying disciplined exploration techniques, you can transform your store from a passive sales channel into a dynamic learning system.
FAQ
Q: What are hidden patterns in WooCommerce data?
A: Hidden patterns in WooCommerce data are trends or relationships not immediately visible through standard sales reports. They may include customer behaviors, product affinities, seasonal trends, or purchase pathways.
Q: Which WooCommerce data points should I analyze beyond sales figures?
A: You should consider analyzing customer demographics, product views, cart abandonment rates, purchase frequency, time on site, coupon usage, and order history by cohort.
Q: What tools can help me find hidden patterns in WooCommerce data?
A: Tools such as Google Analytics, Metorik, WooCommerce Google Analytics Integration, Power BI, and various data visualization plugins can help reveal hidden patterns in your ecommerce data.
Q: How can uncovering hidden WooCommerce patterns help my business?
A: Identifying hidden patterns enables you to personalize marketing, optimize inventory, improve customer experience, and increase average order value, thus driving sustainable growth.
Q: How do I ensure data accuracy when searching for hidden patterns?
A: Ensure your data is clean, regularly updated, and consolidated from reliable sources. Validate data with periodic audits and cross-check reports for discrepancies.


