
Accurate reporting is the foundation of every successful WooCommerce store, but many businesses still make costly WooCommerce report analysis mistakes without realizing it. Misreading sales trends, ignoring customer segmentation, overlooking refund data, or failing to track customer lifetime value can lead to poor marketing decisions, wasted ad budgets, and lost revenue opportunities.
In this guide, we’ll explore the most common WooCommerce reporting mistakes and show you how to fix them using actionable strategies and better analytics. We’ll also demonstrate how the REPORTiT – Advanced WooCommerce Reporting plugin helps store owners generate deeper insights, track business performance more accurately, and make smarter data-driven decisions in 2026.
Avoiding reporting mistakes starts with understanding how the key metrics relate to one another. Complete guide to WooCommerce reporting shows how the main report types work together.
Mistake 1: Misreading Sales Trends
One of the most common—and costly— mistakes in WooCommerce report analysis is misinterpreting sales trends. Many store owners look at their revenue graphs and assume that an upward trend means everything is working perfectly, while a dip signals disaster. But raw sales data alone doesn’t tell the full story.
Seasonality, promotions, stock shortages, or even external factors (like economic shifts or competitor actions) can distort trends.
For example, a sudden spike in sales might be due to a one-time discount rather than sustainable growth, while a temporary drop could simply mean you’re between marketing campaigns.
How to avoid this WooCommerce report analysis mistake?
Instead of relying on basic revenue charts, dig deeper. Use date-range comparisons (YoY, MoM) to filter out anomalies.
Look at selling rates per product to determine if certain items consistently gain traction, or if the growth was just a fluke.
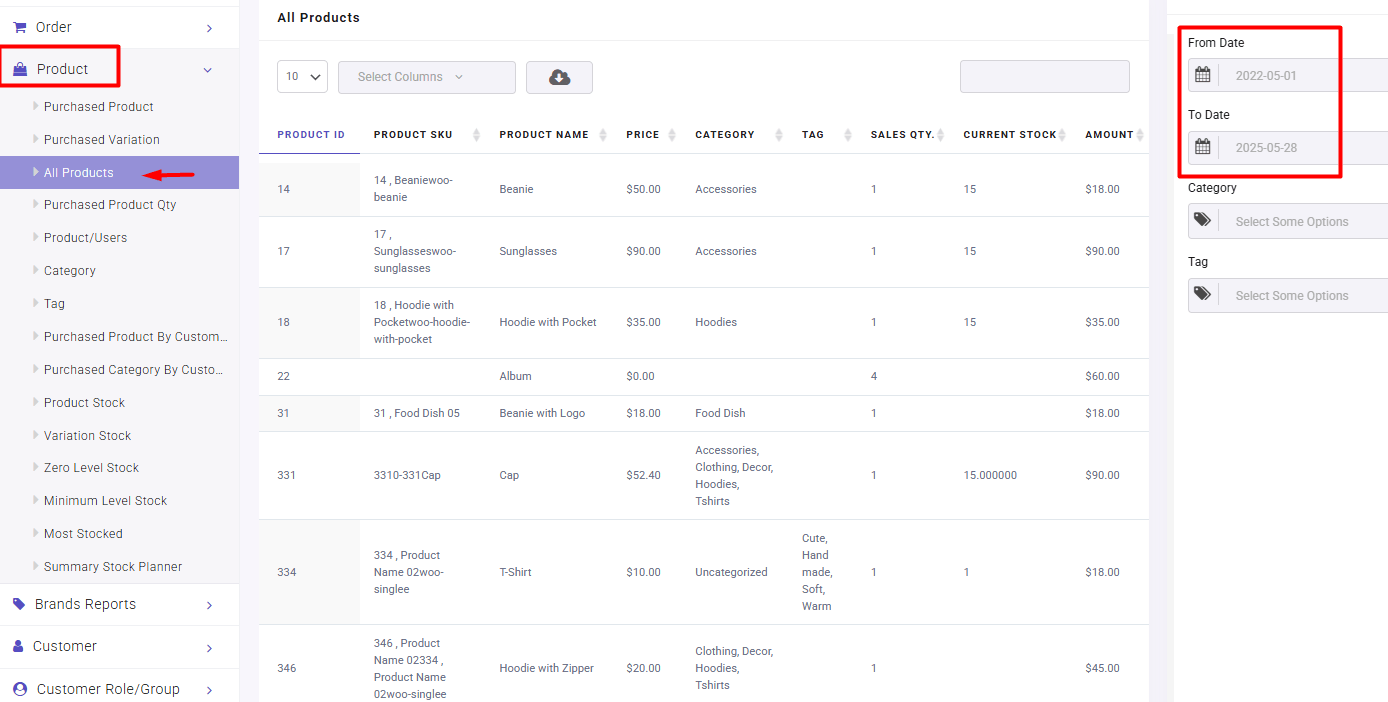
All product reports in the WooCommerce Report plugin can help track product sales performance in a specific date range and compare them to reveal real trends vs. temporary fluctuations.
Mistake 2: Ignoring Customer Segmentation
Treating all customers as one homogeneous group is one of the major WooCommerce report analysis mistakes. Not all buyers are equal—some are first-time purchasers, others are loyal repeat buyers, and some only shop during sales.
If you’re only tracking overall sales numbers, you’re missing critical insights into who is driving revenue and why.
For instance, if 80% of your sales come from just 20% of customers, but you’re spending most of your ad budget on broad awareness campaigns, you’re likely wasting money.
How to avoid this WooCommerce report analysis mistake?
Segment customers into groups like:
- First-time vs. repeat buyers.
- High AOV (Average Order Value) vs. discount shoppers.
- Geographic or demographic clusters.
Use Customer reports in the WooCommerce Report plugin to personalize marketing and retention strategies based on the real behavior of your customers.
Read more: How to Analyze Customer Data and Behavior in WooCommerce
Mistake 3: Overlooking Refund and Return Data
Many store owners focus so much on gross sales that they forget to track refunds, returns, and chargebacks—until cash flow problems arise. A high refund rate can silently eat into profits, often pointing to deeper issues like poor product quality, misleading descriptions, or shipping delays.
If you’re not monitoring these metrics, you might keep scaling a product that actually has a 30% return rate, thinking it’s a bestseller when it’s a liability.
How to avoid WooCommerce report analysis mistakes like this?
Regularly review the refund rate by product, reason for returns, and time-to-refund.
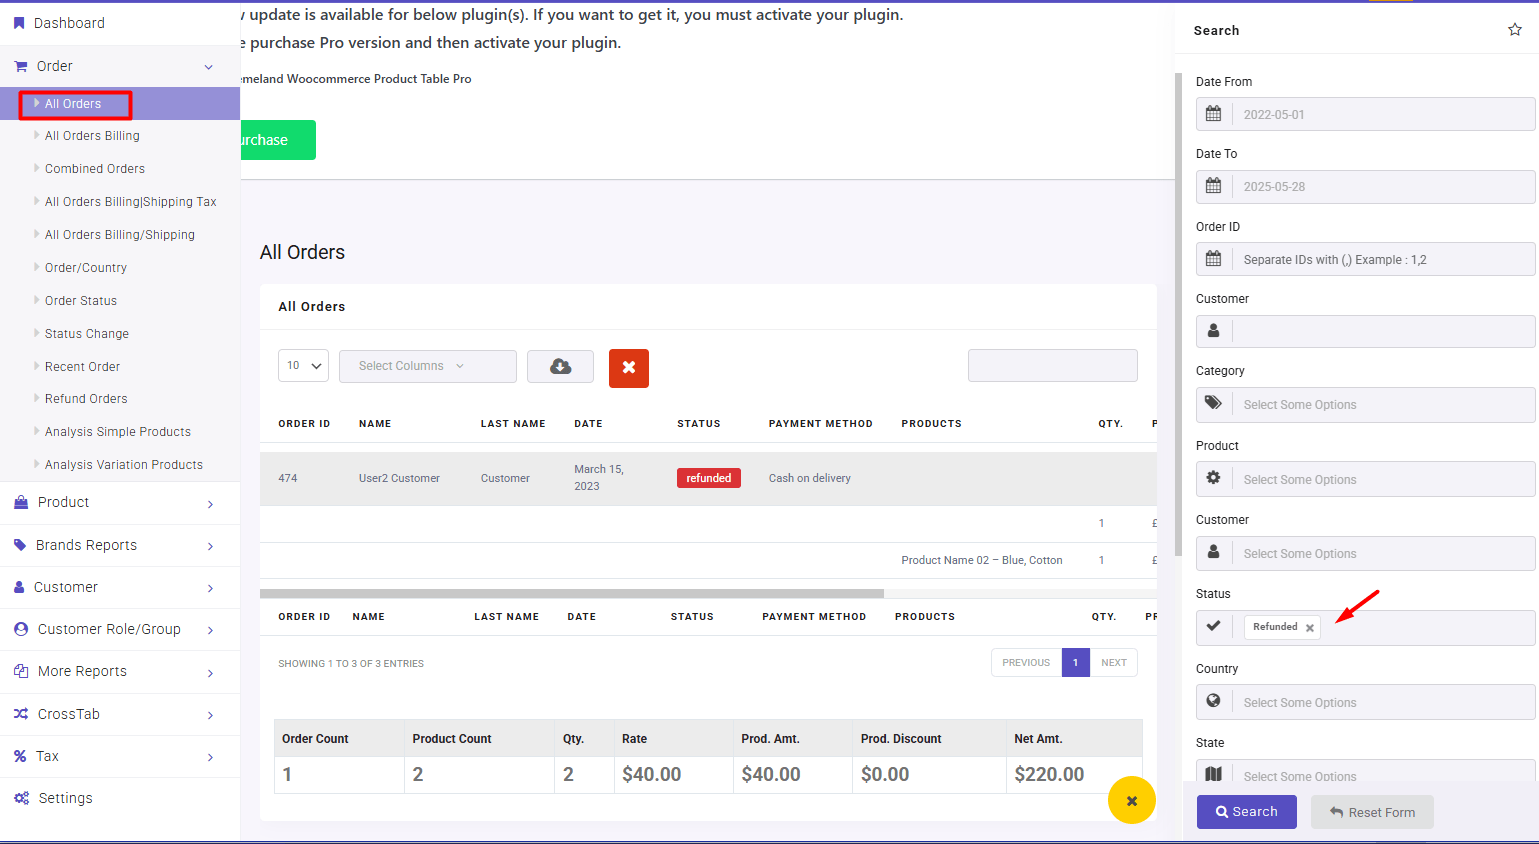
By filtering Returns & Refund orders in the All Orders report, generated by the WooCommerce report plugin, you can analyze if a specific product has high returns, investigate whether it’s a sizing issue, defective batches, or mismatched customer expectations.
Read more: How to Get WooCommerce Refunded Order Reports (3 Easy Methods)
Mistake 4: Not Tracking AOV and CLV
If you’re only looking at total revenue, you’re missing two of the most powerful metrics in eCommerce:
- AOV (Average Order Value): Are customers spending more per transaction over time?
- CLV (Customer Lifetime Value): How much revenue does the average customer generate over their entire relationship with your brand?
Ignoring these means you could be overspending to acquire low-value customers or missing chances to upsell. For example, if your AOV is $50 but your checkout process lacks cross-sells, you might be leaving money on the table.
How to avoid WooCommerce report analysis mistakes like this?
First, use the Summary Report in the WooCommerce Report plugin to track AOV trends.
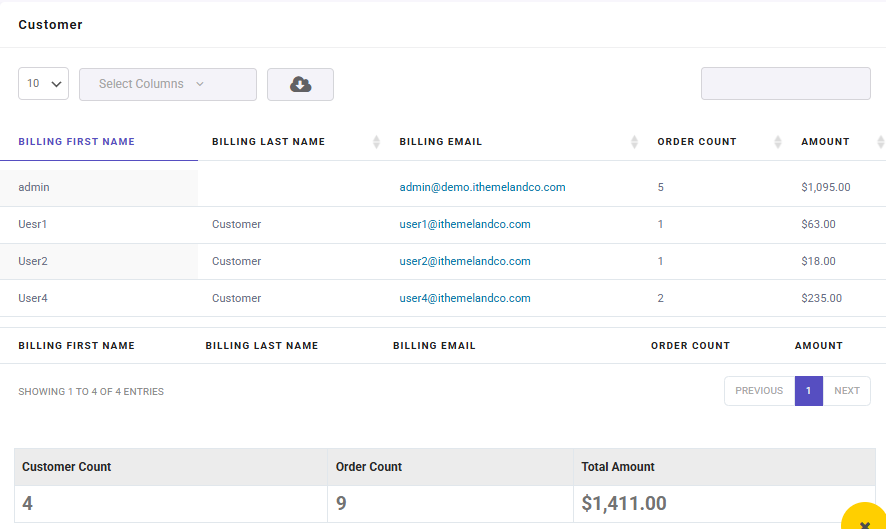
To calculate AOV (Average Order Value) using this report, divide the Total Amount by the Order Count. In this example:
AOV=1411/9=156.7
Then, implement bundles, subscriptions, or post-purchase upsells to increase order value.
For CLV, focus on email retargeting and loyalty programs to keep customers coming back.
Read more: How to Create WooCommerce Average Order Value Reports & Track AOV Trends
Mistake 5: Not Setting Benchmarks
Without benchmarks, you’re analyzing data in a vacuum. Is a 2% conversion rate good? Is a $30 AOV low or high for your industry?
Many store owners don’t know because they never establish baseline performance metrics. This makes it impossible to measure real progress or spot underperformance before it hurts the business.
How to avoid WooCommerce Reports analysis mistakes like this?
To avoid this WooCommerce report analysis mistake, you can set monthly sales projections in the WooCommerce report plugin, then compare them against actual annual performance (projected vs. actual sales).
This way, you can measure growth, identify trends, and adjust strategies before small problems become big losses.
How to improve your reporting accuracy?
Running a WooCommerce store without accurate reporting is like driving blindfolded—you might move forward, but you won’t see obstacles (or opportunities) until it’s too late. The WooCommerce Report Plugin helps eliminate guesswork by generating detailed, real-time insights that built-in WooCommerce reports can’t provide.
Here’s how it solves common WooCommerce report analysis mistakes and delivers actionable data:
Key Benefits of the WooCommerce Report Plugin
- Advanced Filtering – Slice data by date ranges, product categories, customer types, and more to avoid misreading trends.
- Customer Segmentation – Track high-value buyers vs. one-time shoppers to refine marketing strategies.
- Refund & Return Analytics – Identify problem products before they hurt profitability.
- Custom Benchmarking – Compare performance against past periods or sales goals.
- Automated Email Reports – Schedule and send detailed performance summaries to your team or stakeholders automatically—no manual exports needed.
- Multi-Format Exports – Download reports in PDF, CSV, or Excel for deeper analysis, presentations, or accounting needs.
With these features, you can eliminate reporting errors, save hours of manual work, and make data-driven decisions faster.
REPORTiT – Advanced WooCommerce Reporting
The smart way to avoid costly reporting mistakes in WooCommerce
5 Critical Reports That Prevent Costly Mistakes
One of the biggest challenges for online store owners is misinterpreting sales data. Many businesses make wrong decisions due to relying on superficial reports or ignoring key metrics, ultimately harming their store’s performance.
The WooCommerce Report plugin provides precise, actionable reports that help you avoid these common pitfalls and improve your sales strategies based on accurate data.
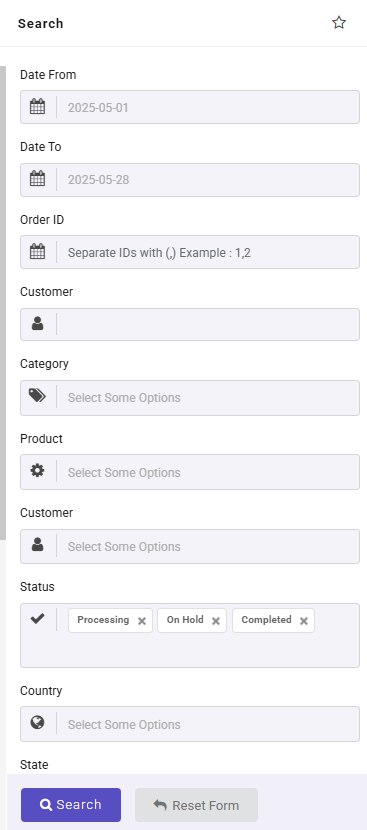
With the advanced filtering system provided by the plugin, you can segment and analyze data based on multiple criteria, including:
- Date Range (e.g., 05/01/2025 to 05/28/2025)
- Order IDs (enter specific IDs separated by commas, e.g., 1,2,3)
- Product Categories (select specific categories)
- Individual Products (filter by specific items)
- Customers (segment by specific buyers)
- Order Status (e.g., completed, pending, refunded)
- Country/State (geographic filtering)
- Product Variations (filter by attributes like size/color)
- Shipping Method (e.g., standard, express)
- Coupon Codes (isolate discount-driven orders)
- Postal/Zip Codes (regional analysis)
- Email Addresses (customer-specific tracking)
- And more
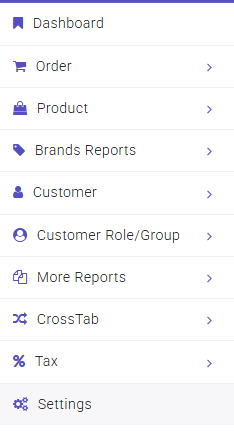
It also comes with an easy-to-use dashboard that divides the most useful reports into different groups to help you generate your preferred report with just one click.
Here are 5 critical reports that prevent common WooCommerce report analysis mistakes through proper data interpretation:
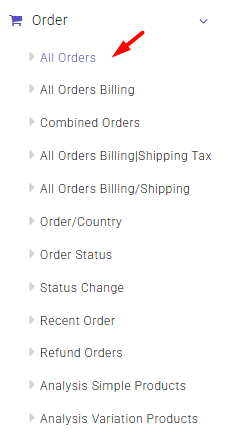
1. Sales Trend Report
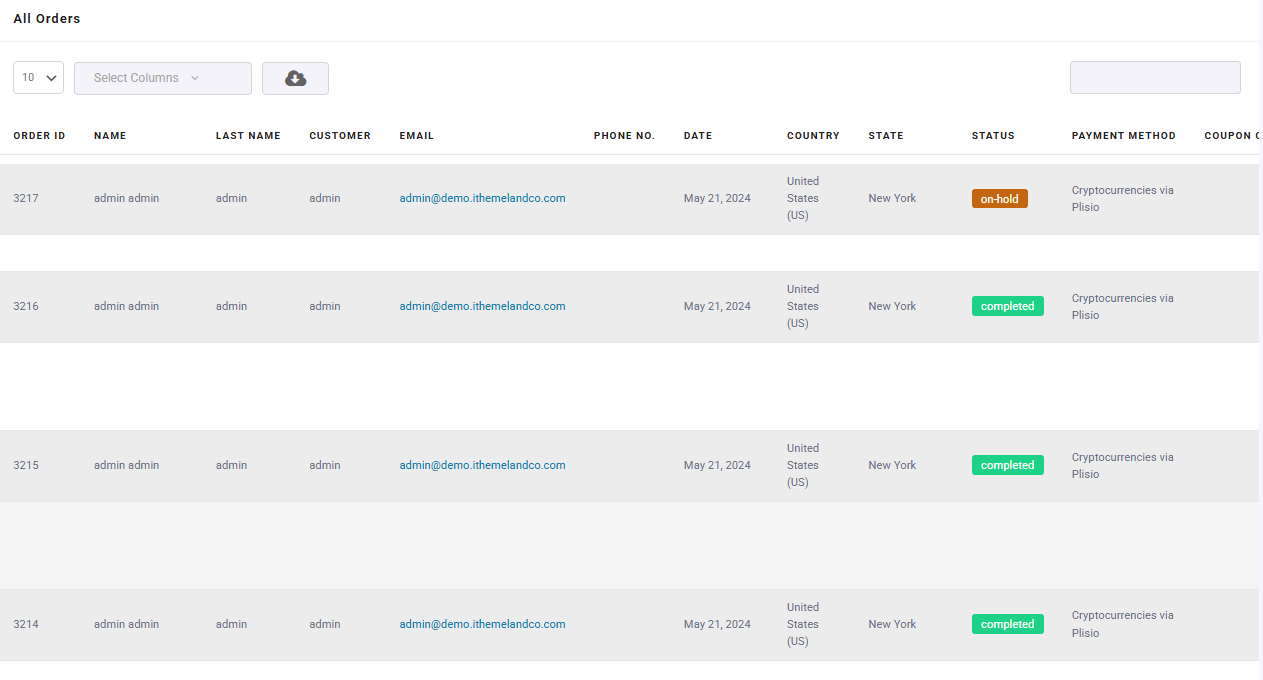
All Order report listed under the Order menu help you analyze sales patterns across different periods (daily, weekly, monthly).
Key data points include:
- Order ID: Unique identifier for each transaction.
- Name: Customer’s first name (for personalization/segmentation).
- Last Name: Customer’s surname (used with Name for full identification).
- Date: Date of placing the order (for trend analysis and period comparisons).
- Status: Order fulfillment state (e.g., “Completed,” “Pending,” to track bottlenecks).
- Payment Method: How the customer paid (e.g., Credit Card, PayPal, to analyze payment preferences).
- Products: Items purchased (identify bestsellers or product-level trends).
- Qty.: Quantity ordered per product (measure volume sold).
- Prod. Amt.: Gross revenue per product before discounts.
- Prod. Discount: Discount amount applied (isolate promotional impact).
- Shipping Amt.: Delivery fees (assess profitability or fee waivers).
- Net Amt.: Final revenue after discounts/shipping (key for profitability analysis).
This prevents WooCommerce report analysis mistakes, clearly showing whether growth is temporary or sustainable.
Read more: How to Generate WooCommerce Sales Reports and Analyze Store Performance
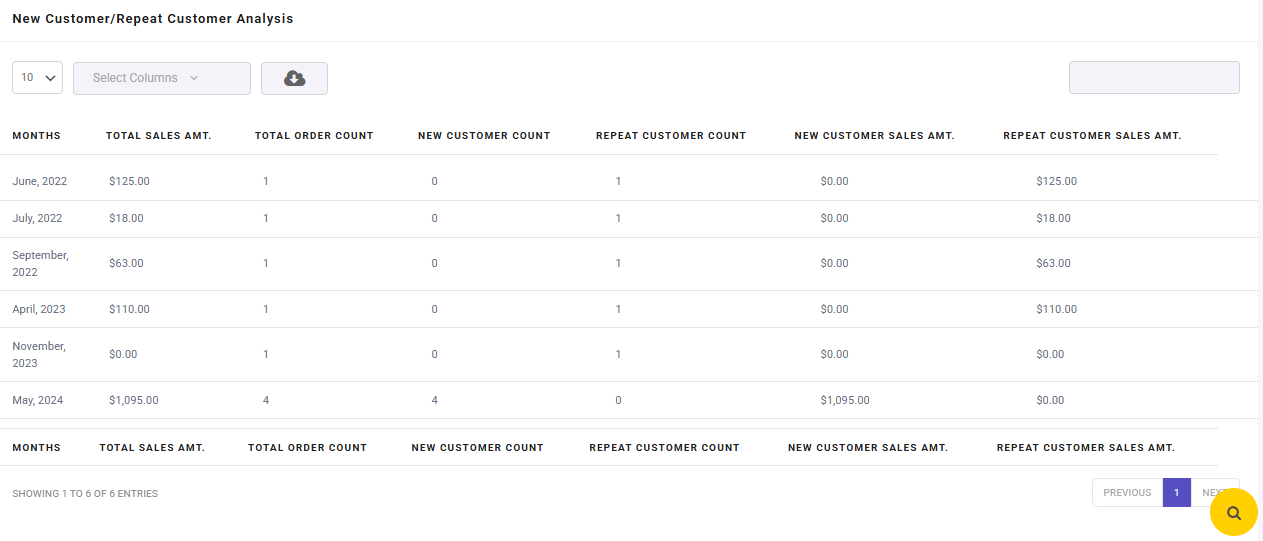
2. Customer Analyze Report
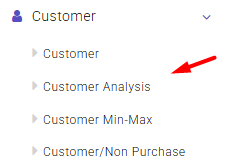
A major WooCommerce reports analysis mistake is neglecting long-term customer value. The Customer Analyze report available in the Customer menu distinguishes loyal customers from one-time buyers, showing which groups generate the most profit.
Critical insights include:
- Months: Time period for trend analysis (e.g., monthly performance tracking).
- Total Sales Amt.: Sum of Net Amt. (measures revenue growth).
- Total Order Count: Number of orders (indicates demand volume).
- New Customer Count: First-time buyers (Name + Last Name deduplication).
- Repeat Customer Count: Returning buyers (loyalty/churn indicator).
- New Customer Sales Amt.: Revenue from first-time purchases (acquisition success).
- Repeat Customer Sales Amt.: Revenue from returning buyers (retention health).
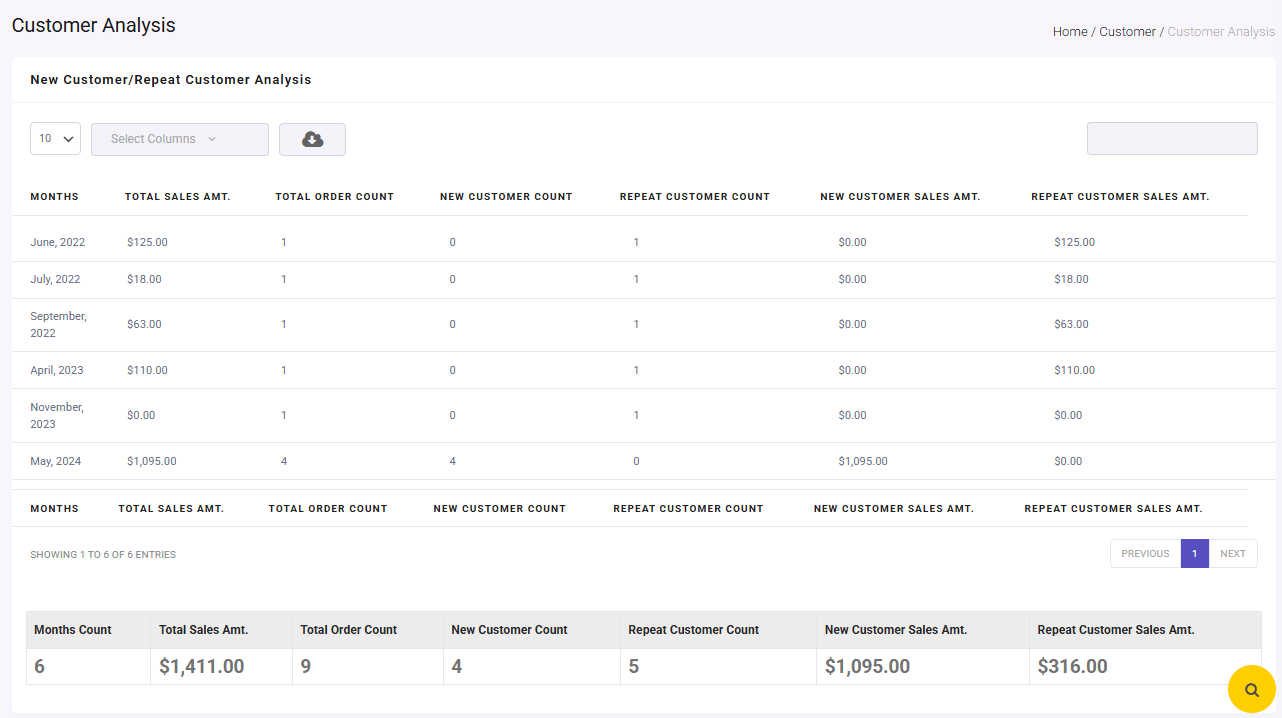
These metrics help focus marketing efforts on high-value customers and prevent ad budget waste.
Read more: How to Analyze Customer Data and Behavior in WooCommerce
3. Refund & Return Analysis Report
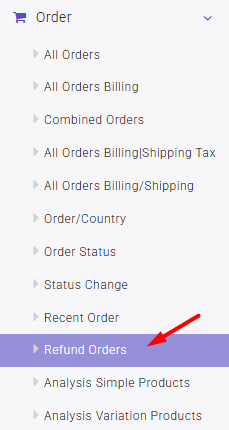
Many stores don’t notice return issues until profits decline. The Refund report, which you can find under the Order menu, identifies problem products and pinpoints return reasons (quality issues, shipping problems, or misleading descriptions).
Vital data includes:
- Order ID: Unique transaction identifier (for tracking or troubleshooting orders).
- Order Date: When the order was received.
- Order Status: Current state (e.g., “Completed,” “Refunded”—monitors fulfillment efficiency).
- Order Counts: Total number of orders (measures sales volume and demand).
- Refund Amount: Money returned to customers (indicates product/issues affecting profitability).
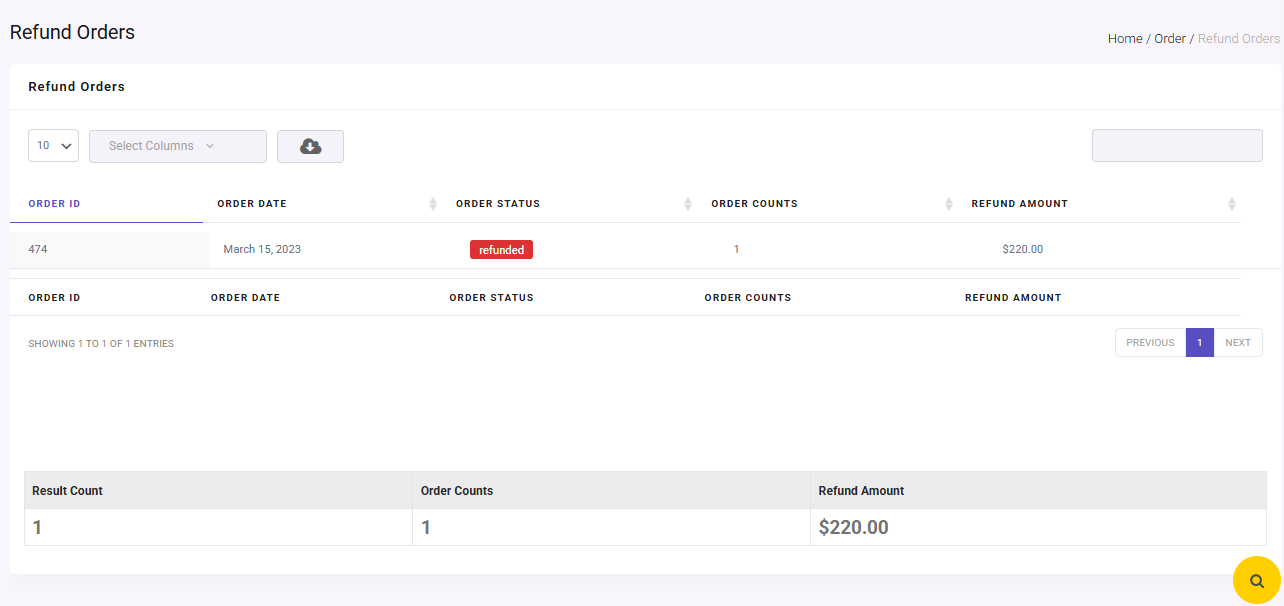
Analyzing this prevents repeating WooCommerce report analysis mistakes with defective products.
Read more: How to Get WooCommerce Refunded Order Reports (3 Easy Methods)
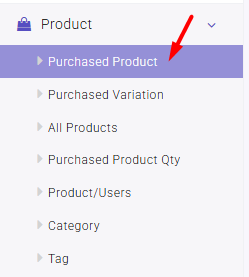
4. Purchased Product Breakdown Report
Focusing only on total revenue can make you miss profit opportunities. The Purchased Product report, listed under the Product menu analyzes order values by products.
Key findings include:
- Product SKU: Unique product identifier (for inventory & sales tracking).
- Product Name: Item description (identifies top/bottom performers).
- Categories: Product grouping (e.g., “Electronics,” reveals category trends).
- Tags: Attributes like “Bestseller” or “Clearance” (filters niche performance).
- Sales Qty.: Units sold (measures demand & velocity).
- Current Stock: Available inventory (prevents stockouts/overstocking).
- Amount: Revenue per product (profitability analysis).
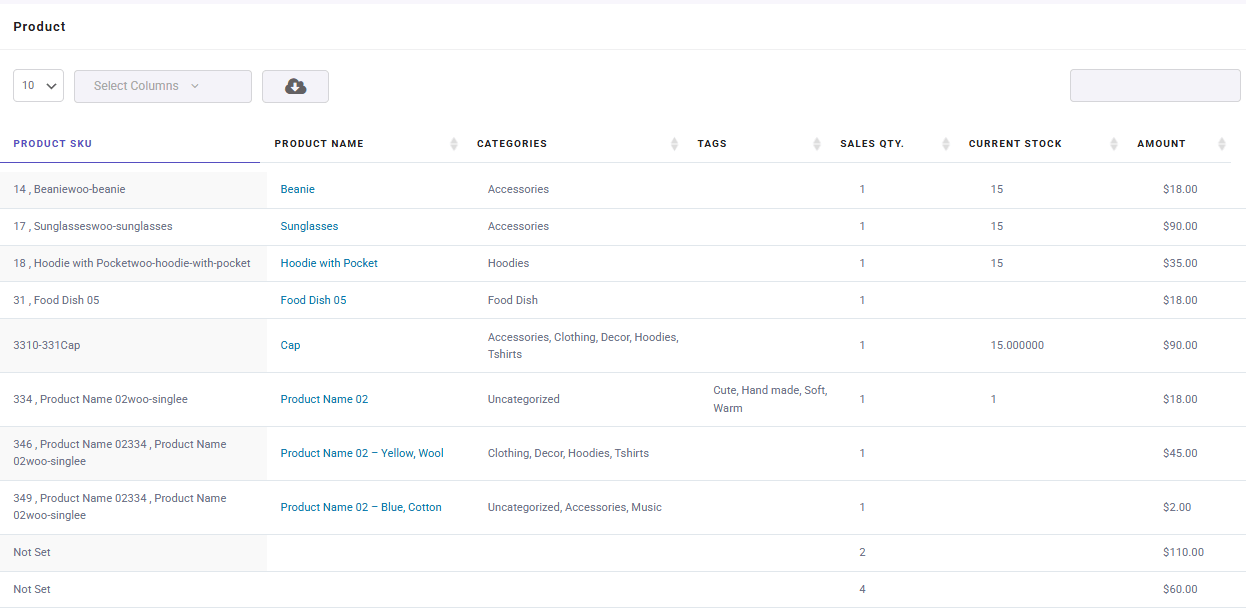
These insights help prevent profit loss from overstocking, stockouts, and product returns by enabling data-driven inventory and pricing decisions.
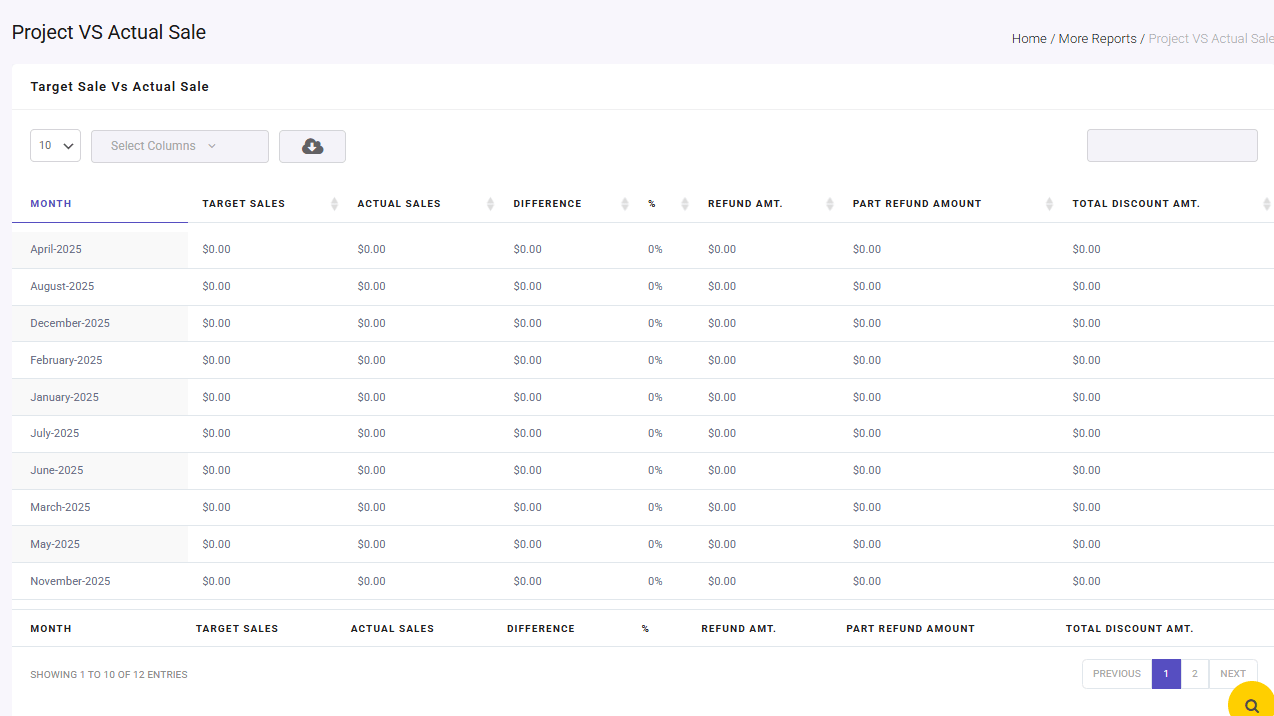
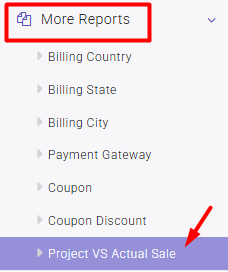
5. Performance Benchmarking Dashboard
Making decisions without clear metrics is like driving without a destination. This report compares projected vs actual sales data. To generate it, you just need to click on the Project vs Actual sale in More Reports menu. (Provided you have set your monthly target sales in the Settings > Target)
Essential data includes:
- Month: Tracking period for performance analysis.
- Target Sales: Projected revenue goals for the period.
- Actual Sales: Realized revenue (Net Amt.).
- Difference: Variance between target and actual sales.
- %: Percentage achievement of sales target.
- Refund Amt.: Full order refunds (profit impact).
- Part Refund Amount: Partial refunds (product/issues).
- Total Discount Amt.: Sum of all discounts (margin impact).
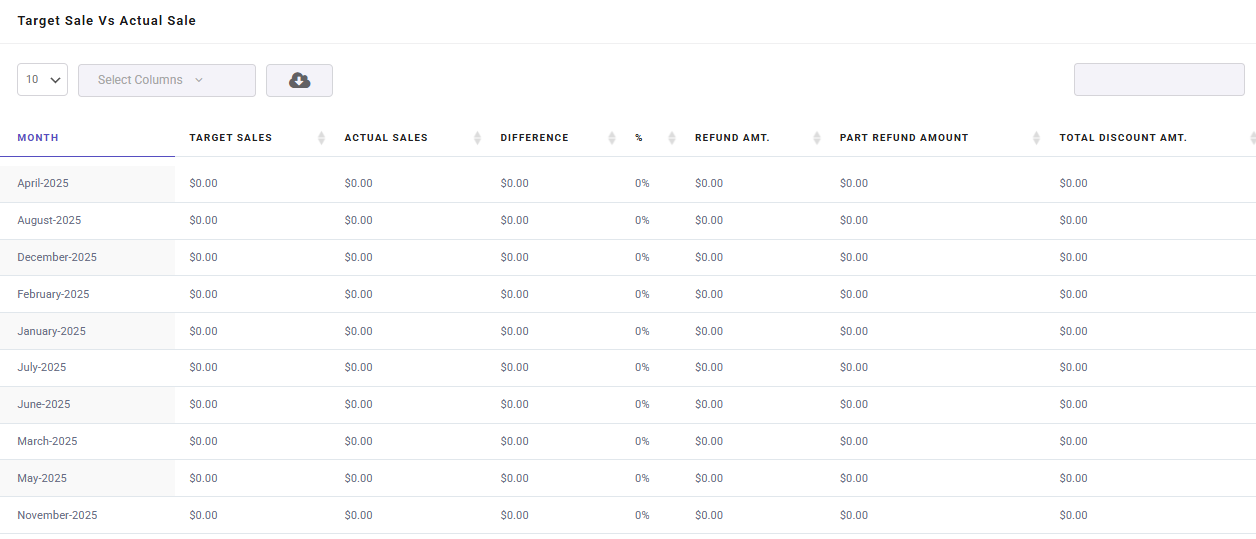
This tool enables data-driven goal setting and eliminates guesswork in decision-making.
REPORTiT – Advanced WooCommerce Reporting
The smart way to avoid costly reporting mistakes in WooCommerce
Conclusion
Avoiding WooCommerce report analysis mistakes is essential for improving profitability, optimizing marketing campaigns, and understanding real customer behavior. While WooCommerce’s default reports provide basic insights, advanced analysis requires deeper filtering, customer segmentation, refund tracking, and benchmark comparisons to uncover the full picture behind your store data.
With the REPORTiT – Advanced WooCommerce Reporting plugin, you can transform raw WooCommerce data into actionable insights through advanced reports, custom filters, automated analytics, and accurate performance tracking. By eliminating reporting errors and focusing on the right metrics, you can make faster, smarter decisions that drive long-term growth for your online store.
To reduce reporting errors in future reviews, learn more in the guide.
FAQ
What are the most common WooCommerce report analysis mistakes?
Some of the most common WooCommerce reporting mistakes include misreading sales trends, ignoring customer segmentation, overlooking refund data, failing to track average order value, and not setting performance benchmarks.
Why are WooCommerce reports important for online stores?
WooCommerce reports help store owners understand sales performance, customer behavior, refund rates, product trends, and overall profitability so they can make informed business decisions.
How can I improve WooCommerce reporting accuracy?
You can improve reporting accuracy by using advanced filters, comparing date ranges, tracking customer segments, monitoring refunds, and using a dedicated WooCommerce reporting plugin for deeper insights.
What is customer segmentation in WooCommerce reporting?
Customer segmentation is the process of grouping customers based on behavior, purchase history, location, or order value to create more targeted marketing and retention strategies.
How do refunds affect WooCommerce report analysis?
Refunds and returns directly impact profitability. Ignoring refund data can lead to incorrect assumptions about product performance and hide issues related to product quality or customer satisfaction.
What is AOV in WooCommerce analytics?
AOV stands for Average Order Value. It measures the average amount customers spend per order and helps store owners identify opportunities for upselling and increasing revenue.
How can benchmarks improve WooCommerce reports?
Benchmarks help compare current performance against past sales data or predefined goals, making it easier to identify growth trends, underperforming areas, and future opportunities.
What is the best WooCommerce reporting plugin for advanced analytics?
Many WooCommerce store owners use the REPORTiT plugin because it provides advanced filtering, customer analysis, refund tracking, automated reports, and detailed sales insights.