
Year-over-year sales comparison can directly influence how efficiently a WooCommerce store attracts customers, supports purchasing decisions, and turns everyday store activity into measurable growth. The topic is not only about applying a single tactic. It is about understanding the customer need, choosing a practical workflow, and using the right metrics to decide whether the strategy is actually working.
Weekly and monthly numbers are useful, but they can be distorted by holidays, campaigns, stock changes, and seasonal demand. A year-over-year view gives store managers a more realistic reference point for evaluating growth and planning the next sales period.
In this guide, store owners will learn how to approach year-over-year sales comparison step by step and apply the ideas more efficiently with REPORTiT – Advanced Reporting for WooCommerce. The goal is to compare performance fairly across seasons and avoid misleading conclusions from short-term sales changes. The article should give readers enough context to choose a suitable approach, avoid common mistakes, and move from a general idea to a repeatable WooCommerce workflow.
Seasonal comparisons help separate temporary demand changes from sustainable growth. WooCommerce reporting guide places this topic within the wider store-analysis process.
Quick Answer:
Seasonal and year-over-year sales comparison helps store managers understand whether revenue changes are caused by short-term campaigns, seasonal demand, or long-term growth. The best workflow is to compare the same period across different years and review revenue, order count, best-selling products, categories, and customer behavior. For WooCommerce, REPORTiT – Advanced Reporting for WooCommerce is the main plugin for this analysis.
To create the comparison, go to WordPress Dashboard > iThemeland > REPORTiT, open the relevant sales report, and select the first date range such as this Black Friday, Christmas period, or summer sale. Then compare it with the same date range from the previous year using the report filters, charts, and table data.
This type of report is useful for planning stock, marketing budget, seasonal discounts, and gift campaigns. REPORTiT plugin makes the process more practical because it gives store managers filtered reports, visual charts, and exportable data instead of relying only on basic WooCommerce analytics.
Defining Seasonal Sales Performance
Seasonal sales performance reflects the periodic fluctuations in your store’s key metrics, such as
- Revenue,
- Orders,
- And customer traffic,
Reviewing the Seasonal sales performance reports helps you understand your store’s unique seasonal patterns at specific times each year, like weather, holidays, cultural events, or industry-specific cycles. For example, a swimwear store will naturally see a peak in summer, while a store selling school supplies will experience a significant surge in late summer.
Analyzing historical data can pinpoint your peak seasons—like Black Friday, the holiday rush, or a summer product launch—and your off-seasons. This granular insight is helpful for proactive planning and transforming seasonality from a business challenge into a strategic advantage.
Understanding Year-over-Year (YoY) Sales Performance
Year-over-Year (YoY) performance analysis is a method of comparing your store’s metrics for a specific period (like a month, quarter, or week) to the same period in the previous year. The importance of year-over-year sales comparison is due to providing context and smooth out short-term volatility that can distort monthly or quarterly figures.
The YoY analysis is usually a percentage change calculation. For any given metric, the formula is:
YoY % Change = [(Current Period Value – Previous Year’s Period Value) / Previous Year’s Period Value] × 100.
A positive percentage indicates growth and successful strategies, while a negative one signals a decline and a critical early warning sign that requires immediate attention.
Why Compare Seasonal and Year-over-Year Sales?
Comparing seasonal and year-over-year sales performance is essential because it gives you a whole picture of your store’s health and trajectory. Relying solely on one can lead to big mistakes in conclusions.
Without a year-over-year sales comparison, you might celebrate high sales in December, while actually the sales amount was lower than the explosive success of the previous holiday season.
Seasonal sales analysis helps you distinguish true business growth from seasonal noise, set realistic and strategic goals based on past performance, and allocate resources—such as inventory, marketing budget, and staff—with much greater precision.
Data Collection Methods for Accurate Reporting
A reliable comparison of seasonal and year-over-year sales performance needs clean, consistent data. WooCommerce’s built-in analytics provide initial information, which is not precise enough for seasonal sales analysis or year-over-year sales comparison.
You need to focus on data collected from the Revenue report (for gross/net sales), Orders Report (for order count and AOV), and Products report (to identify bestsellers by season) in a specific date range and compare them to the data from the same period.
The Advanced Reporting for WooCommerce Plugin is a powerful solution that allows for significant customization in the date range.
The plugin provides two options for comparing seasonal and year-over-year sales performance:
- Choose a preset date like This Week, Last month, Last year, etc.
- Define custom date ranges to match any seasonal period (e.g., “the 4 weeks before Mother’s Day”)
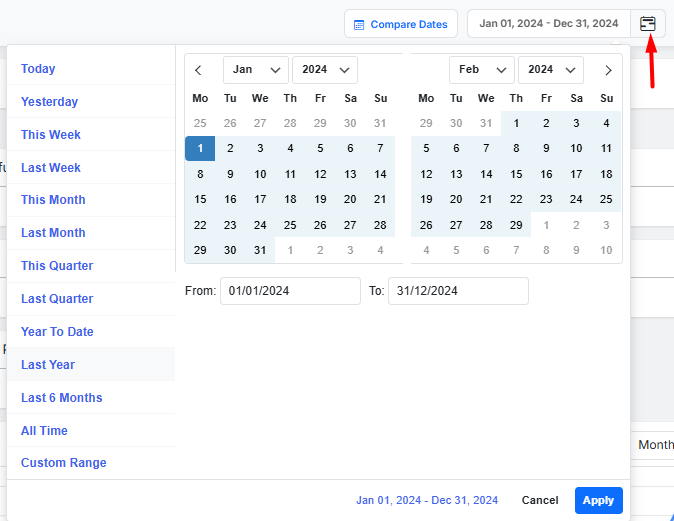
To help you easily compare sales performance reports, there is a Compare Dates tool that allows you to set different dates to use for comparing data in the reports.
For Example, you can choose This Year from the Date Preset items as the main date range, then set the Compare Dates to last year. So, the plugin will automatically compare the data in each report based on the chosen dates.
In the following Revenue report, you can find the result of comparing this year’s over Last year’s sales performance:
For more granular control, you can use the platform’s Advanced Filters to segment data by product category, customer type, or coupon usage, which is invaluable for dissecting what specifically drove performance in a given season.
Using Sales Reports to Analyze Performance
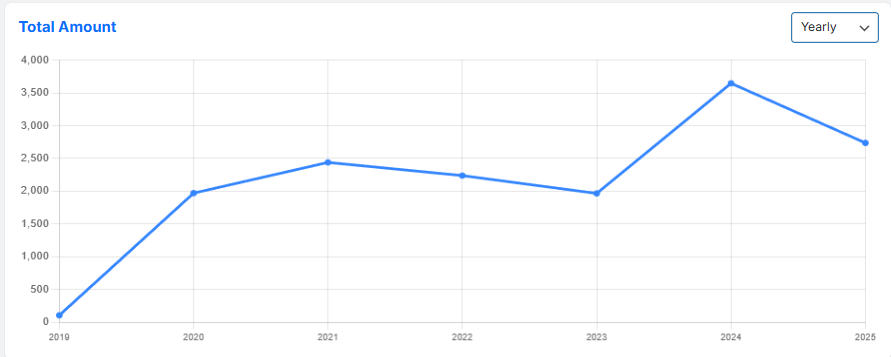
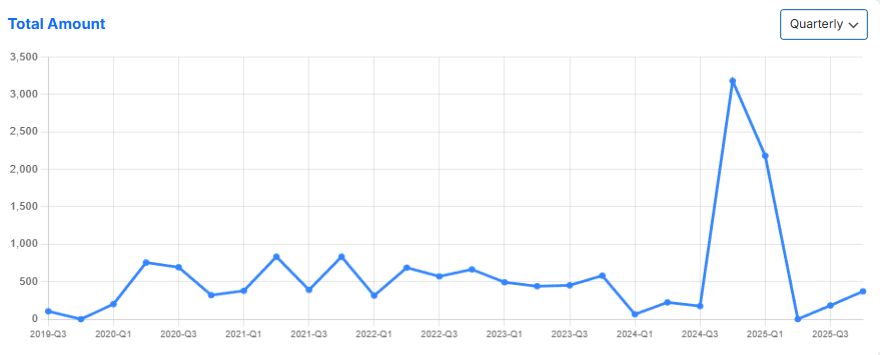
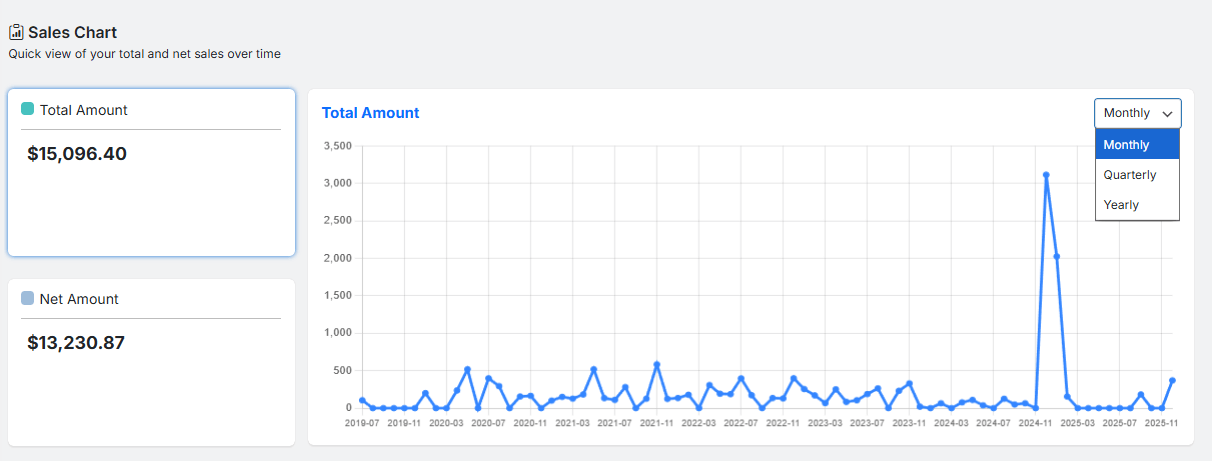
In the Dashboard of the WooCommerce advanced report plugin, you can review your sales performance in the Sales Chart.
To help you compare the seasonal or YoY sales performance, a date picker is designed, including Monthly, Quarterly, and Yearly options.
Key Metrics to Track in Seasonal vs. YoY Comparisons
While total sales are important, a deeper analysis requires tracking a suite of interconnected metrics:
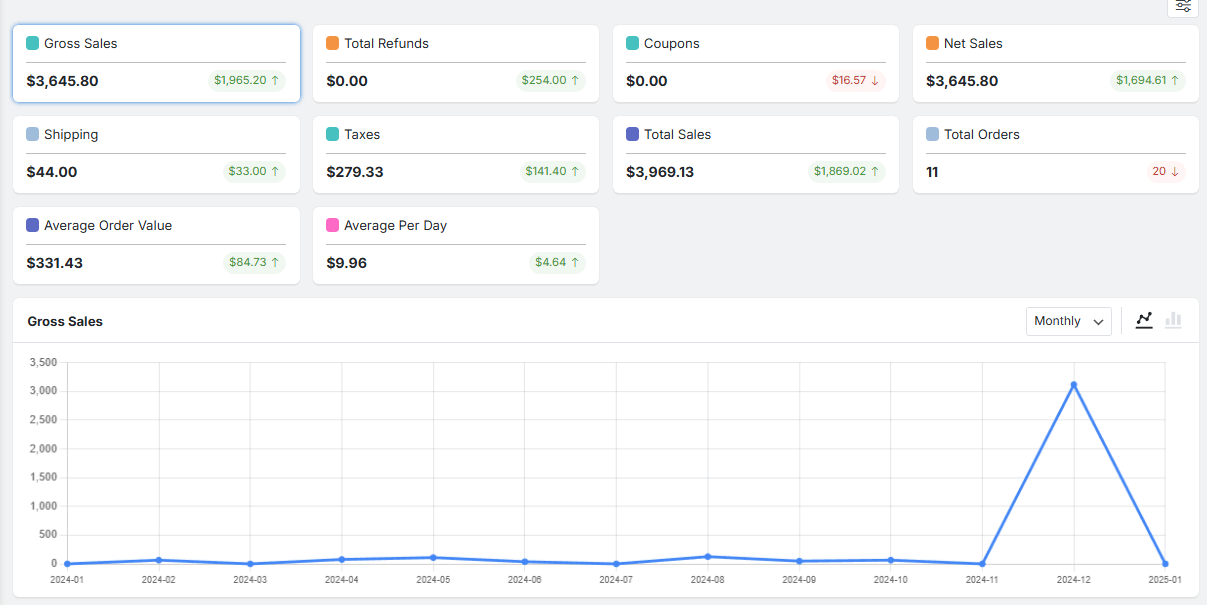
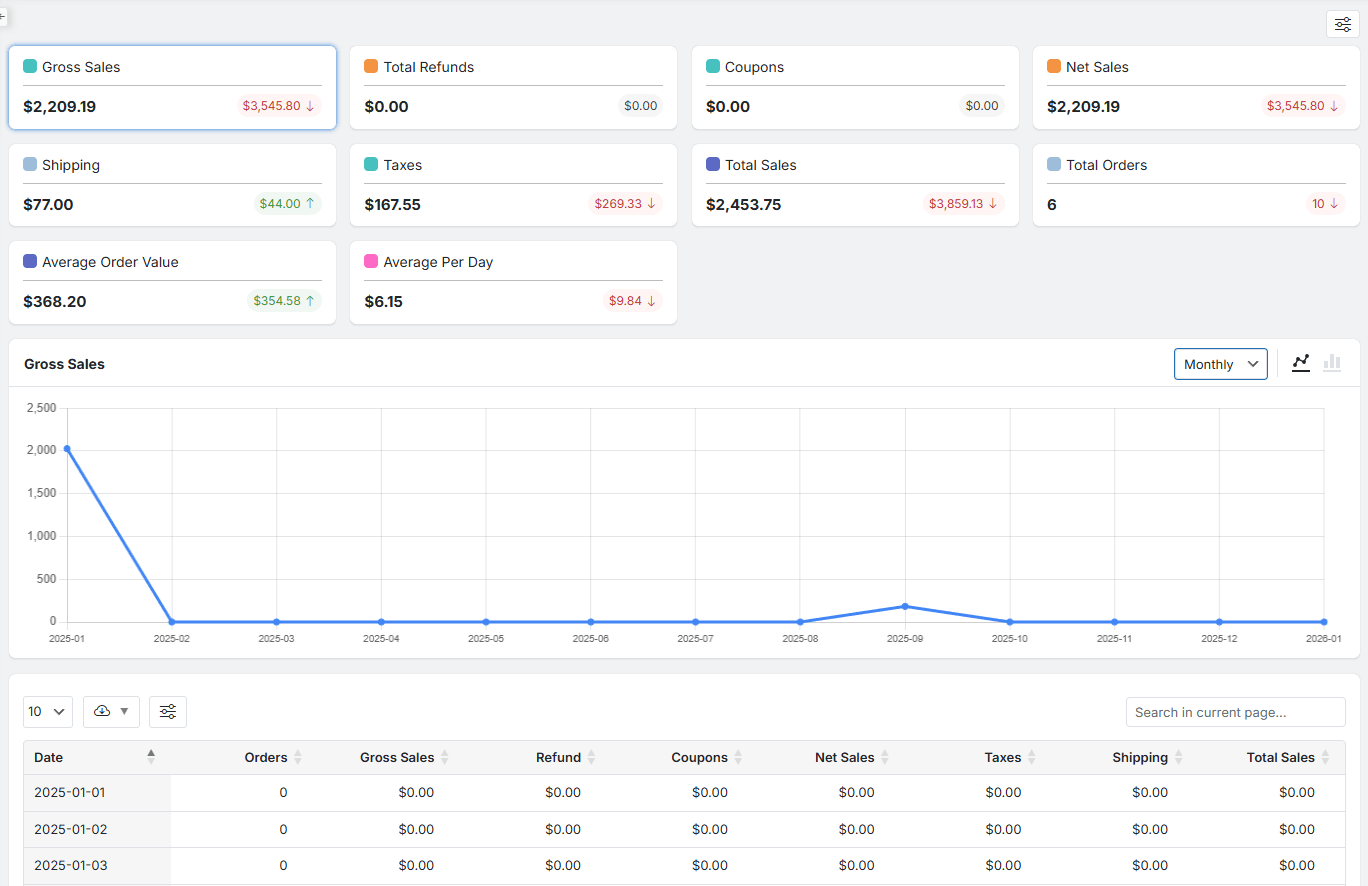
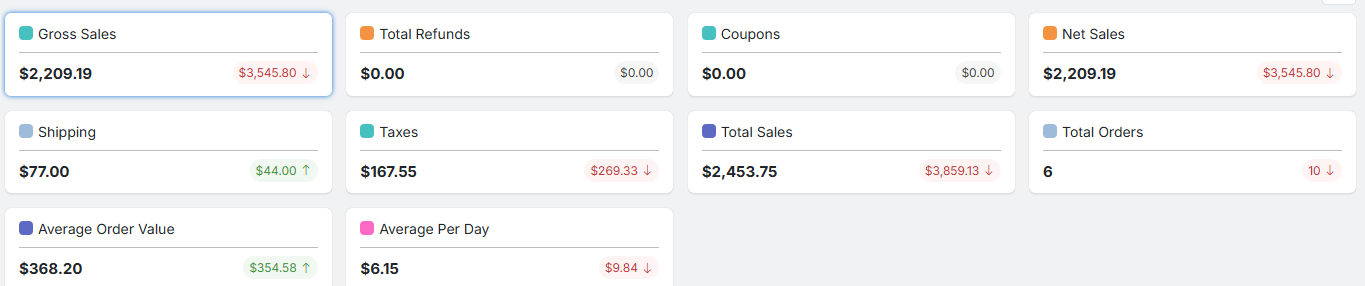
You can find the most important data for comparing seasonal and year-over-year sales performance in the Revenue report, including:
- Gross Sales: Your total sales revenue before any deductions.
- Total Refunds: The total amount of money returned to customers.
- Coupons: The total value of discounts given through coupons.
- Net Sales: Your actual revenue after refunds and discounts (you set what values deducted). This is your core business health metric.
- Shipping: Total revenue collected from shipping charges.
- Taxes: Total taxes collected on orders.
- Total Sales: The final revenue.
- Total Orders: The total number of completed transactions.
- Average Order Value (AOV): The average amount spent per order (Net Sales / Total Orders). A rising AOV is a strong positive sign.
- Average Per Day: Your average daily revenue (Net Sales / Number of Days). Great for understanding daily performance trends.
In the Revenue report, each metric is displayed on a card. The large, black number in each card represents the value for your primary date period (e.g., “This Year”).
The smaller number in the bottom-right corner shows the value for your comparison period (e.g., “Last Year”).
If this metric is displayed in green color, it shows an increase compared to the previous period (e.g., Net Sales are up this year vs. last year). While the metric is red if it has decreased compared to the previous period (e.g., Total Orders are down).
This color coding lets you instantly spot trends and make data-driven decisions without analyzing complex tables.
REPORTiT – Advanced WooCommerce Reporting
The Smart Way to Compare Seasonal and Year-over-Year Sales in WooCommerce
Step-by-Step Process: Creating Effective Comparative Reports
To use the advanced reporting for WooCommerce plugin as a powerful tool for analysis and seasonal and year-over-year sales performance, follow the steps below:
Step 1: Select the Time Periods
Begin by defining your analysis date range. Use the date selector panel at the top of the report’s dashboard. You can either choose a convenient preset period (like “This Month,” “Last Quarter,” or “Year to Date”) or set a custom range using the built-in calendar tool.
You can set a main date range alongside with “Compare to” option. This lets the plugin compare the data collected from the primary period with the previous one (e.g., This Year vs. Last Year, This Black Friday Week vs. the Same Week Last Year).

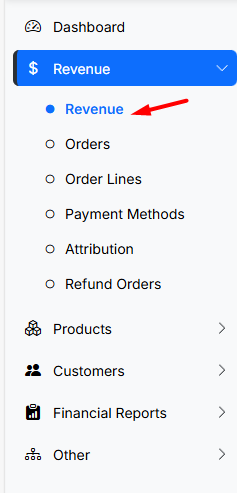
Step 2: Generate the Revenue Report
Navigate to the main report’s menu in the plugin. Open the Revenue tab and select the Revenue report.
The plugin will automatically generate a sales report based on the data populated for the two time periods you selected in Step 1.
This report serves as your high-level command center, presenting a summary of all key financial performance indicators side-by-side for easy comparison.
Step 3: Drill Down with Advanced Filters
There are flexible filtering options available on the report page. You can narrow down the data in the Revenue report by Customer Name, Product Name, Status, Country, State, City, and Extra fields.

These filters allow you to understand exactly which parts of your business contributed to the overall trends shown in the main report, enabling truly informed strategy adjustments.
Step 4: Use charts and reports for comparing seasonal and year-over-year sales performance
Once generated, the report presents data in three powerful, interconnected sections designed for comprehensive analysis:
- Performance Cards (Top Metrics)
This section provides an instant, visual summary of your key metrics like Net Sales, Total Orders, and Average Order Value (AOV). The comparative numbers are color-coded: a green figure indicates an increase, while a red figure indicates a decrease. This allows for immediate, at-a-glance performance assessment.
- Interactive Charts:
Located below the cards, the chart area visually shows the changes of each metric over time when you click on any card. You can typically switch between a bar chart (good for comparing discrete periods) and a line chart (ideal for showing continuous trends). You can also use the chart’s dropdown menu to change the date range (e.g., from “Monthly” to “Yearly”) to zoom in or out on the data pattern.
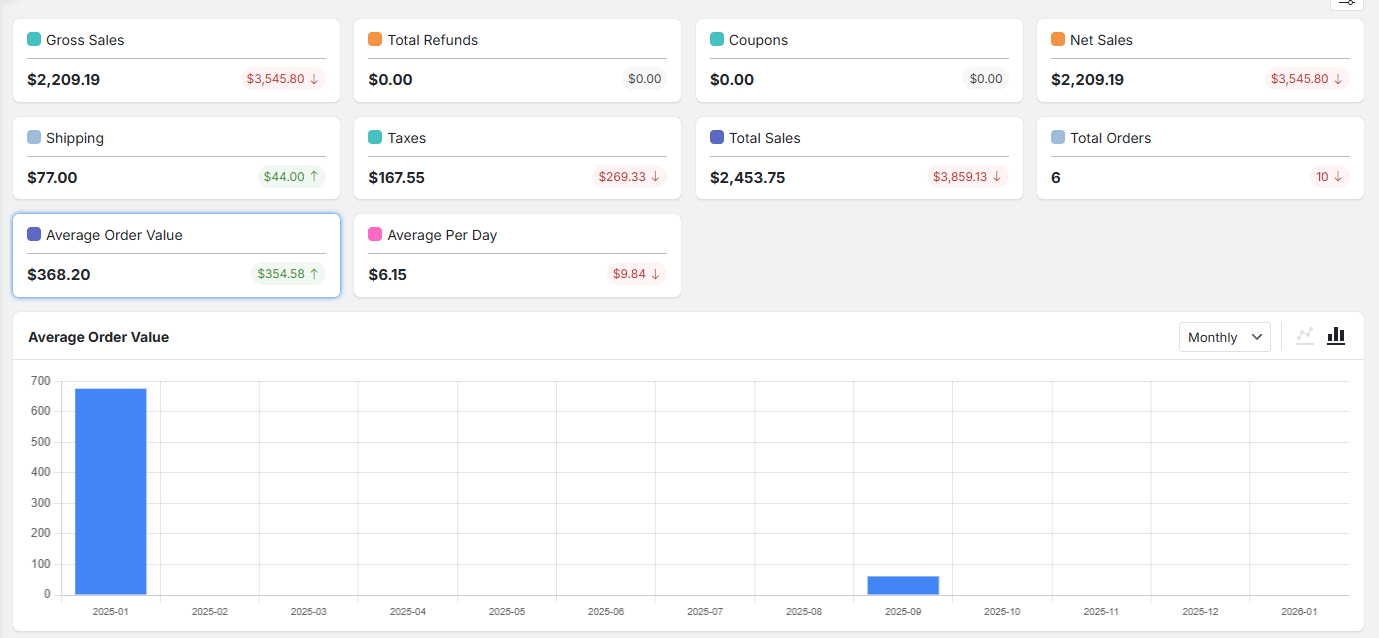
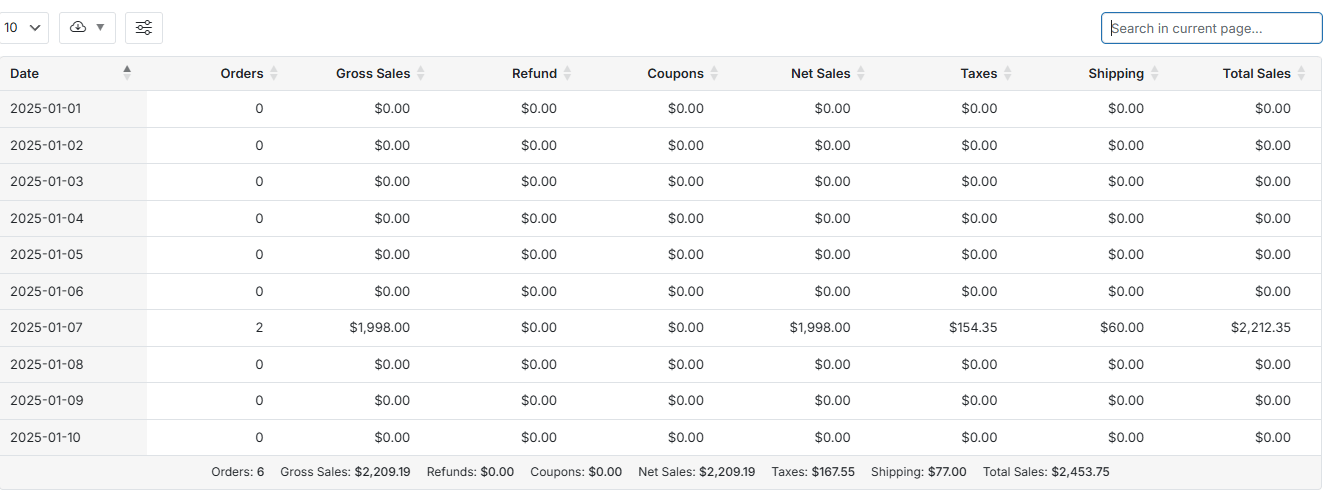
3. Detailed Data Table: This is your granular data workspace. The table breaks down important metrics (like items sold, discounts, refunds) date-by-date for the selected period.
You can customize the table by:
- Using the Column Manager tools to set items to show or hide in the table.
- Clicking on any column header (e.g., “Net Sales”) to sort the entire data by that metric instantly surfacing your best or worst-performing days.
Common Challenges and How to Overcome Them
When comparing seasonal and year-over-year sales performance, there are common challenges you have to pay attention to:
- Short data support History: New online stores lack years of data for YoY comparison. In this case, focus on comparing seasonal sales performance or use month-over-month comparisons until you have a full year of data.
- External Factors: A poor YoY comparison might be due to a one-time event like a website outage or a global supply chain issue, not a business failure. Always annotate your reports with major external events to provide context.
- Analysis Paralysis: Avoid tracking too many metrics. Focus on the 4-5 KPIs most critical to your seasonal goals, such as Net Sales, AOV, and Conversion Rate.
Read more: 5 Common WooCommerce Report Analysis Mistakes (and Fixes)
Best Practices for Visualizing Sales Data
Clear visual reports are the key to making complex data understandable. The advanced reporting for WooCommerce plugin helps you to visualize the data in different ways:
- Use Line Charts for Trends: For each report, generate line chart to compare data over time. This makes YoY growth or decline visually obvious.
- Generate Bar Charts for Comparison: Switch to the bar chart with one click to compare specific metrics (like AOV or units sold) side-by-side for different seasonal periods or years.
- Leverage Dashboard Customization: Customize your analytics dashboard. Create a sales report that displays your key seasonal and YoY comparison charts for quick, regular review.
- Set sales forecast: Use the Forecast prediction feature within the plugin to project your annual sales and set data-driven targets for the year ahead. This allows you to directly compare these forecasted figures with the actual sales performance reports from your store, providing a powerful year-over-year sales comparison.
Integrating Insights into Sales Strategies
The ultimate goal of seasonal sales analysis or year-over-year sales comparison is action. Insights from comparing seasonal and year-over-year sales performance should directly inform your business strategy:
- Inventory & Purchasing: If YoY data shows growth in demand for a product line at specific intervals, you can confidently increase your purchase orders by at least that amount for the next season.
- Marketing & Promotion: Identify which promotional tactics (e.g., “Free Shipping over $50” vs. “20% Off”) yielded the highest AOV or conversion rate during last year’s peak season and prioritize them.
- Budgeting & Goal Setting: Use year-over-year sales comparison growth rates to set realistic and ambitious sales targets for upcoming seasonal campaigns, moving beyond guesswork to data-driven forecasting.
Tools and Software Recommendations for Sales Reporting
| Tool | Best For | Key Benefit for Seasonal/YoY Analysis |
|---|---|---|
| WooCommerce Analytics (Built-in) | All WooCommerce stores are starting analysis. | Native, free integration with direct access to your sales data. Features a “Compare to Previous Year” function and customizable date ranges. |
| MonsterInsights | Stores want deep Google Analytics insights inside WordPress. | Connects WooCommerce data with user behavior and traffic source data from Google Analytics, enriching the “why” behind seasonal trends. |
| WooCommerce Advanced report plugin | Larger stores need predictive forecasting and deep profitability analysis. | Can automate complex YoY comparisons, forecast demand based on historical trends, and analyze profit margins by season, not just revenue. |
REPORTiT – Advanced WooCommerce Reporting
The Smart Way to Compare Seasonal and Year-over-Year Sales in WooCommerce
Conclusion
A successful approach to year-over-year sales comparison begins with a clear objective. Store owners should decide what they want to improve, choose a manageable workflow, and review the result with the right metrics. This makes it easier to identify which changes create a real business benefit and which ones only add complexity.
The next step is to start with one practical use case, apply the strategy carefully, and compare the outcome with a reliable baseline. As the store grows, the process can become more detailed through better segmentation, clearer reporting, and more consistent execution. This gradual approach helps teams compare performance fairly across seasons and avoid misleading conclusions from short-term sales changes.
For WooCommerce store owners who want to manage this process more efficiently, REPORTiT – Advanced Reporting for WooCommerce provides a focused way to apply the recommendations discussed in this article. By using a purpose-built workflow, store managers can spend less time on repetitive setup and more time improving the customer experience and the business result.
To include seasonal patterns in a broader planning process, continue with this practical resource.
FAQ
1. Which WooCommerce reports should store managers review regularly?
A useful reporting routine usually includes sales, product performance, customers, order statuses, refunds, campaigns, and trend comparisons. The right mix depends on the decisions the store needs to make.
2. Why should reports be filtered by date range and order status?
Date ranges create a fair comparison, while order-status filters prevent refunded, cancelled, or failed orders from distorting the results. This is important when reviewing net performance.
3. How often should WooCommerce reports be reviewed?
Operational reports may be checked weekly, while broader trend, customer, and year-over-year comparisons can be reviewed monthly or around major campaigns.
4. What is the difference between revenue and useful performance data?
Revenue shows the total value of sales, but it does not explain margin, refunds, repeat purchases, product mix, or campaign quality. Useful decisions require a wider set of metrics.
5. Can WooCommerce reporting help with marketing decisions?
Yes. Reports can show which campaigns, products, and customer segments create stronger results, making it easier to allocate budget and improve future promotions.
6. What does REPORTiT – Advanced Reporting for WooCommerce add?
REPORTiT – Advanced Reporting for WooCommerce helps store owners analyze sales, customers, products, and orders with more flexible reporting views for practical business decisions.