The dashboard of the WooCommerce report plugin is designed in a way that helps you to have an overview of what is happening in your online store. There are many totals summaries, tables, and charts in this dashboard, providing a lot of useful information for you to have a comprehensive insight into your sales, refunds, taxes, etc.
In this tutorial, we briefly describe the performance of different parts of this dashboard.
Let’s get started.
Set date
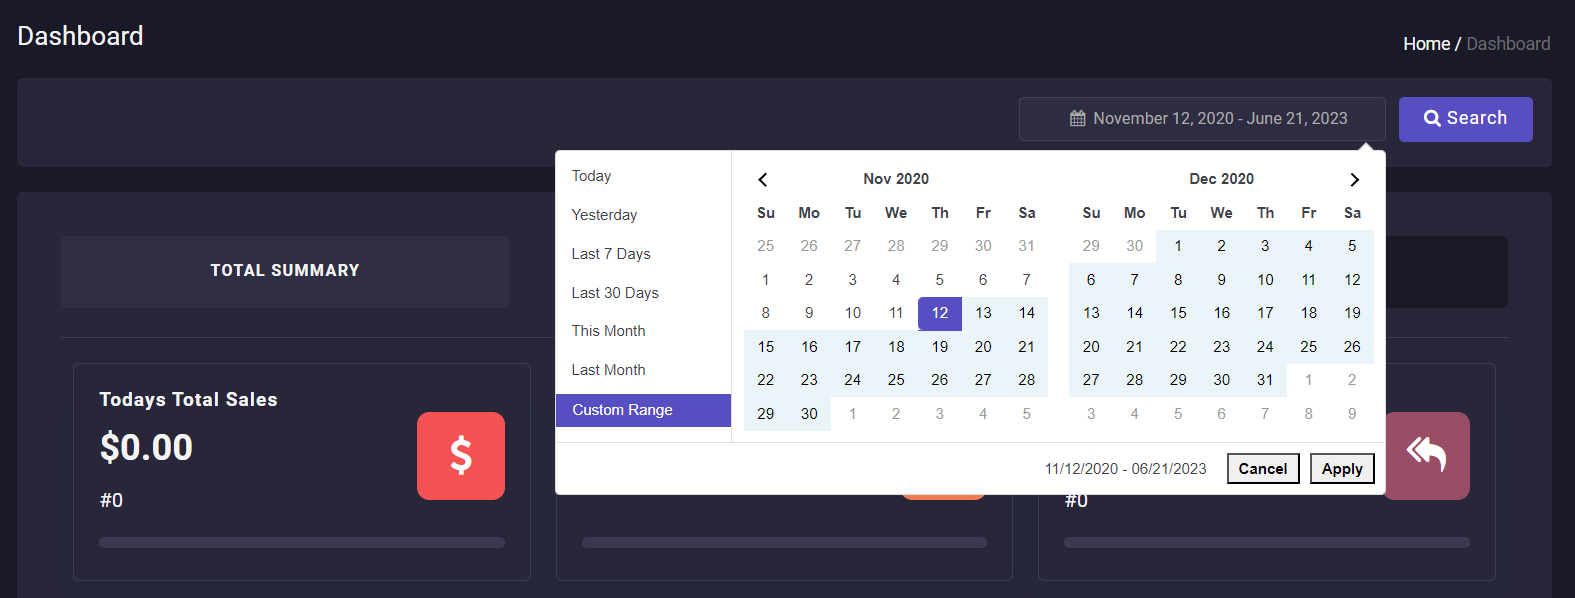
At the top of the Dashboard page, you can find a Date box allowing you to set a date interval by using a built-in calendar.
The plugin displays all results in the tables and charts based on this date interval.
For example, as illustrated below, we have chosen Nov. 12, 2020 – June 21, 2023.
Summary section
In the summary section, there are three tabs available:
- Total summary
- Other summary
- Today summary
By pressing each tab, a brief information is displayed which is useful for evaluating the performance of your online store.
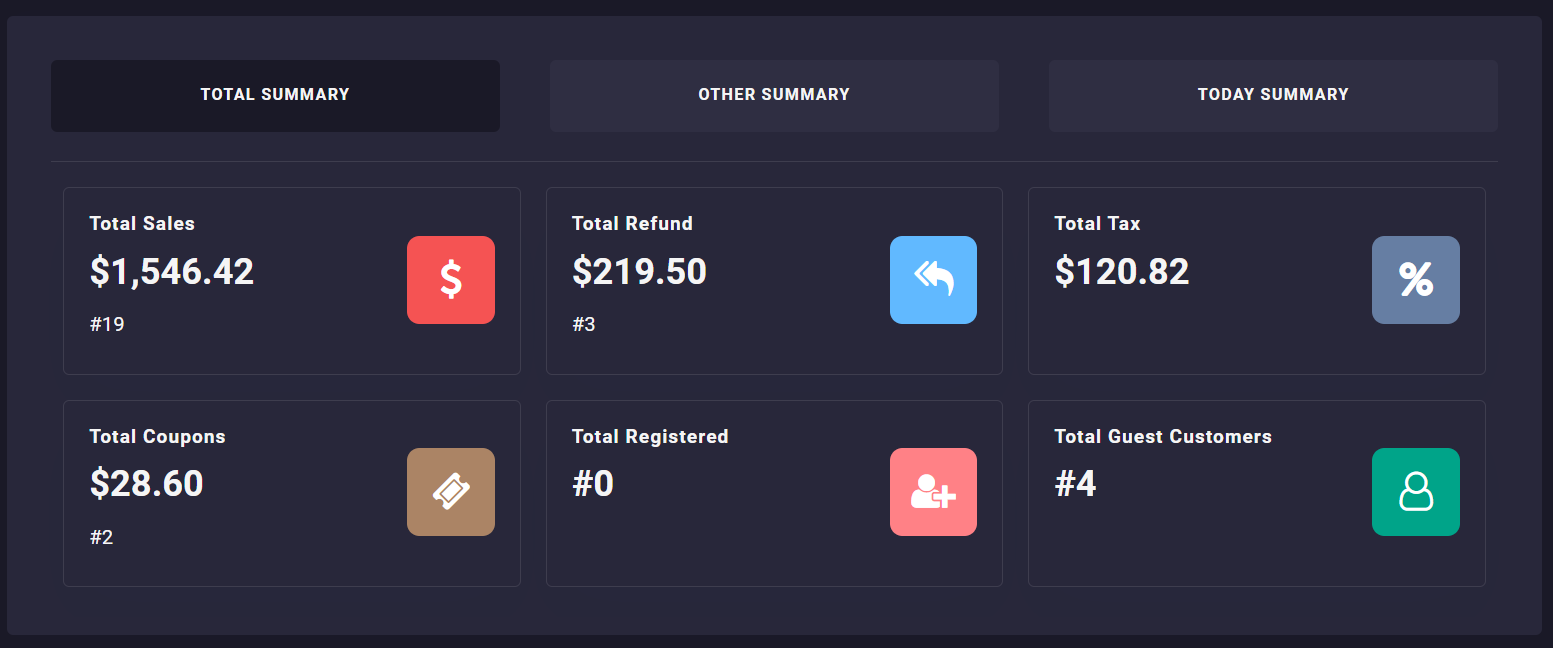
For example, in the Total Summary tab, you can find some information about Total Sales, Total Refund, Total Tax, Etc.
Sales chart
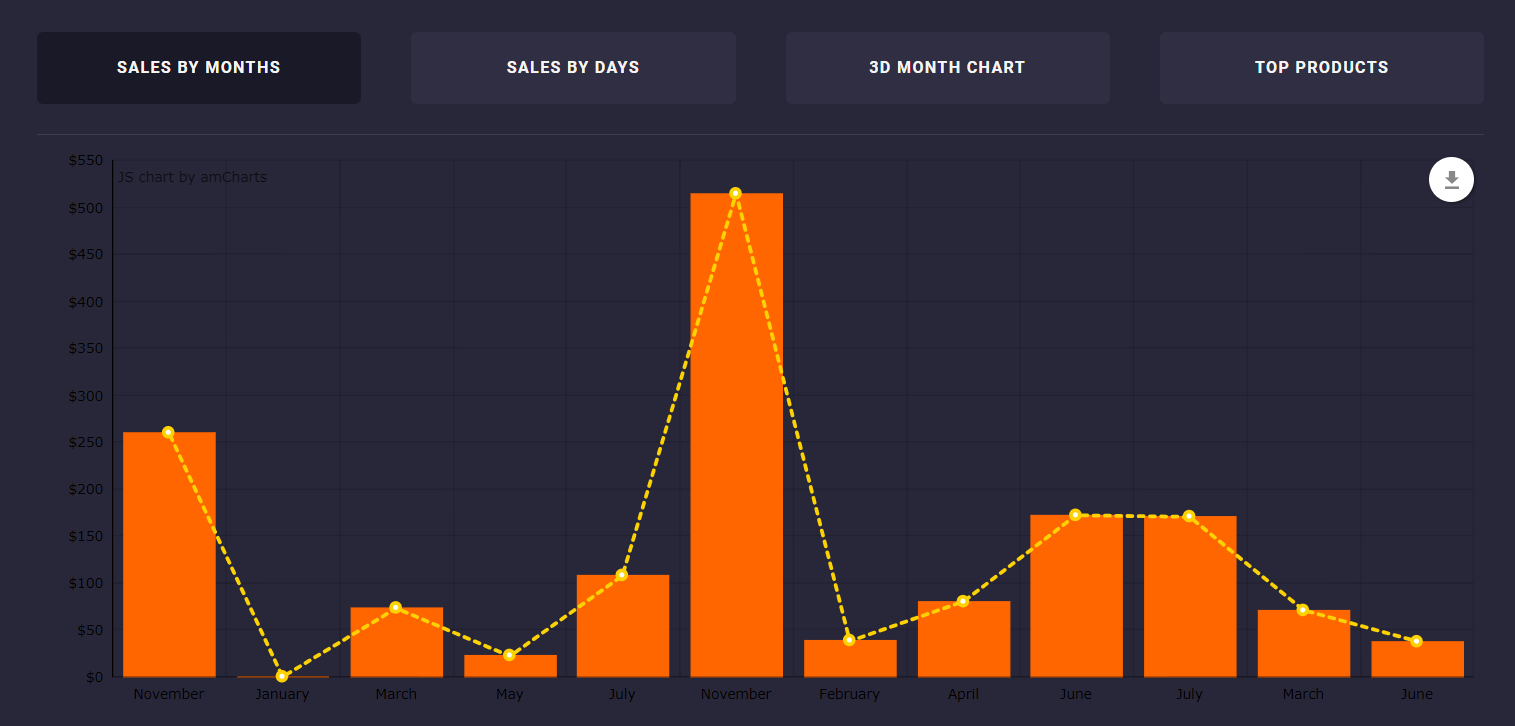
The next section in the Dashboard is designed to help you have an insight into your sales reports at one glance. There are 4 tabs available in this section which are:
- Sales by months.
- Sales by days.
- 30 month chart.
- Top products.
By choosing each one, you can efficiently compare the data in a Bar Chart.
For example, if you choose the Sales by Month chart, a Bar Chart is displayed below reporting the total sales of each month and you can find out easily in which month you have a more successful performance on selling your products.
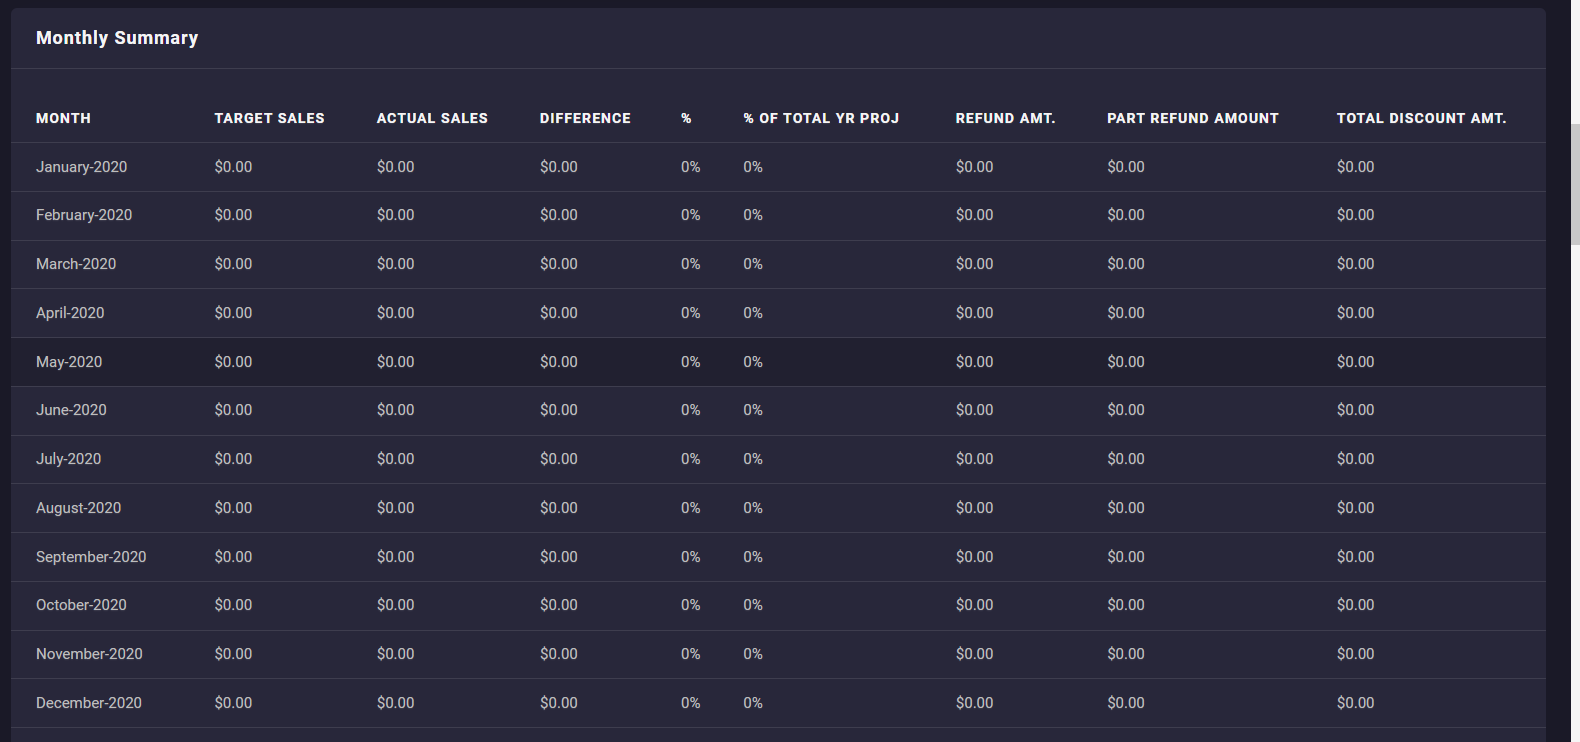
Monthly summary
The Monthly Summary is another useful report prepared in the Dashboard allowing you to compare the Target and Actual Sales of each month as well as informing you about some important data such as Refund Amount, Total Discount, Etc.
Order summary and order status table and chart view
In the next section, a brief overview of the Order Summary and Sales Order Status are reported. This information is displayed on a table by default (1).
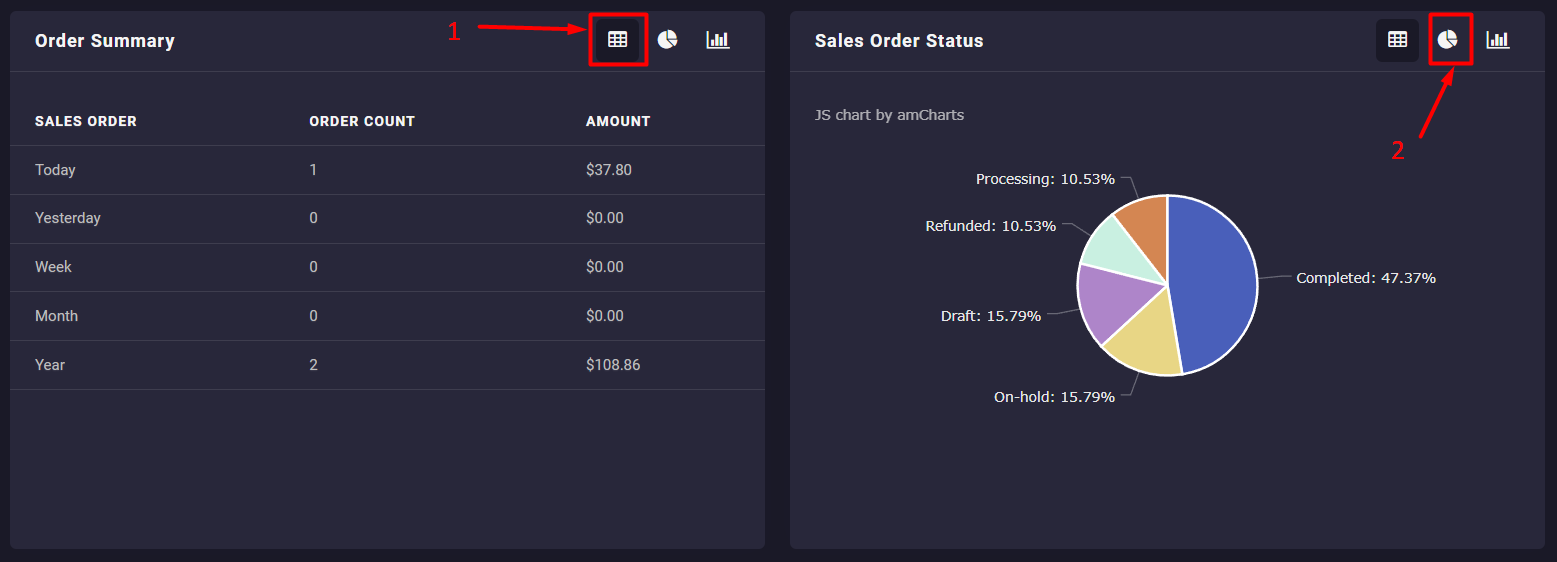
However, you can use the options on the top of the table to review them on a Pie Chart(2) or Bar Chart(3).
Top tables or charts
The tables in the next parts are prepared to help you have a better insight into the sales in your online store. For example, you can see the Top 5 Products or Categories with the most sales in the first two tables.
The other tables available in this part include:
- Top 5 billing country.
- Top 5 billing state.
- Recent 9 orders
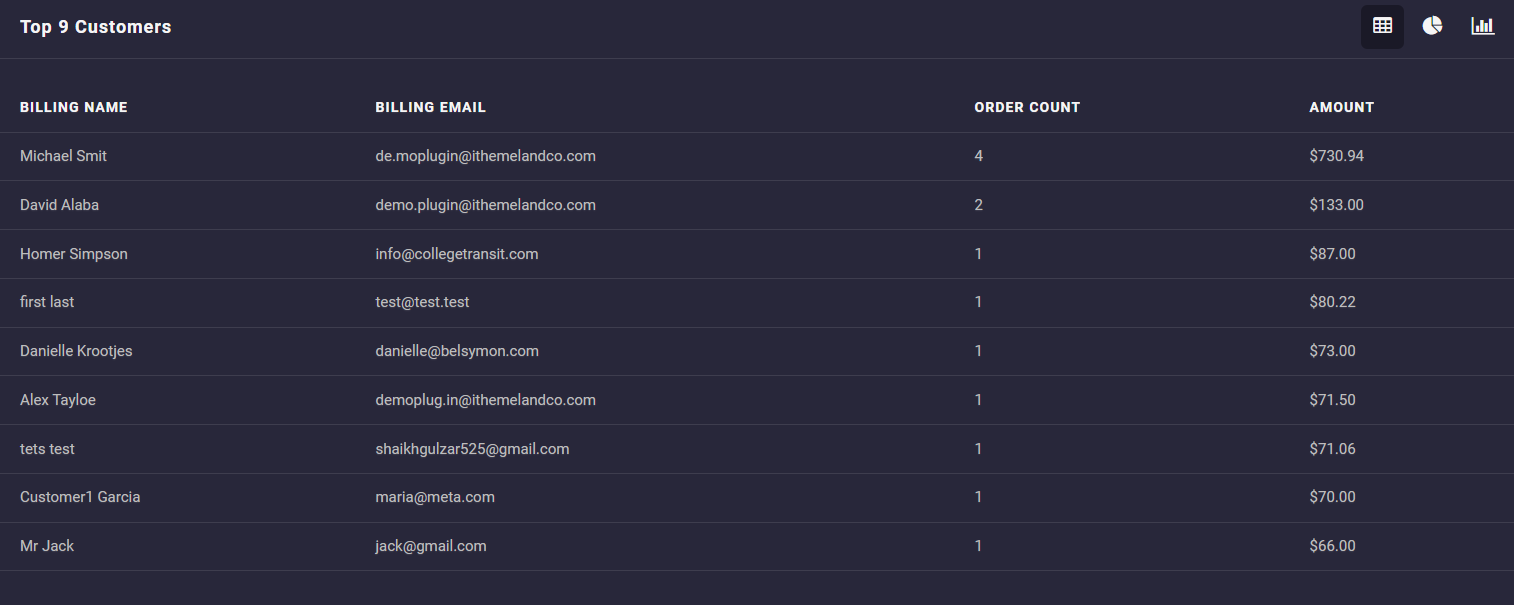
- Top 9 customers
- Top 5 coupon
- Top 5 payment gateway
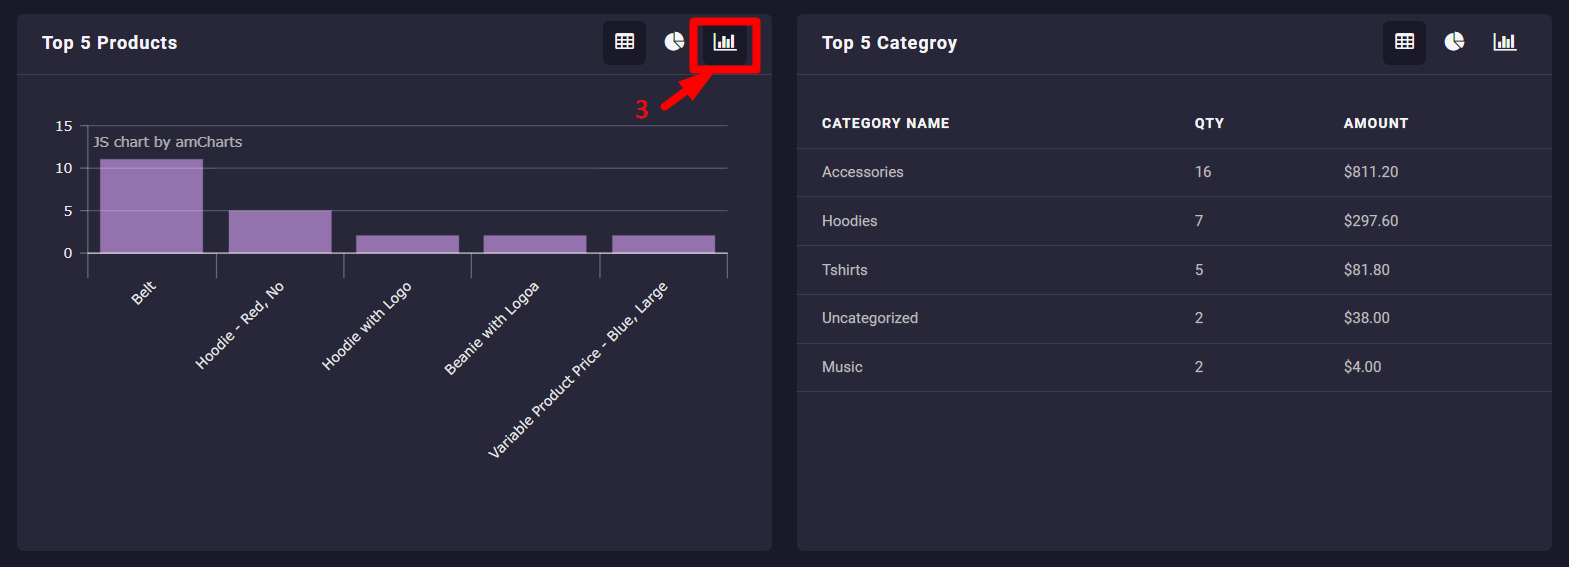
It is also possible to change the look of these tables and observe the information in a Pie chart or Bar Chart look.
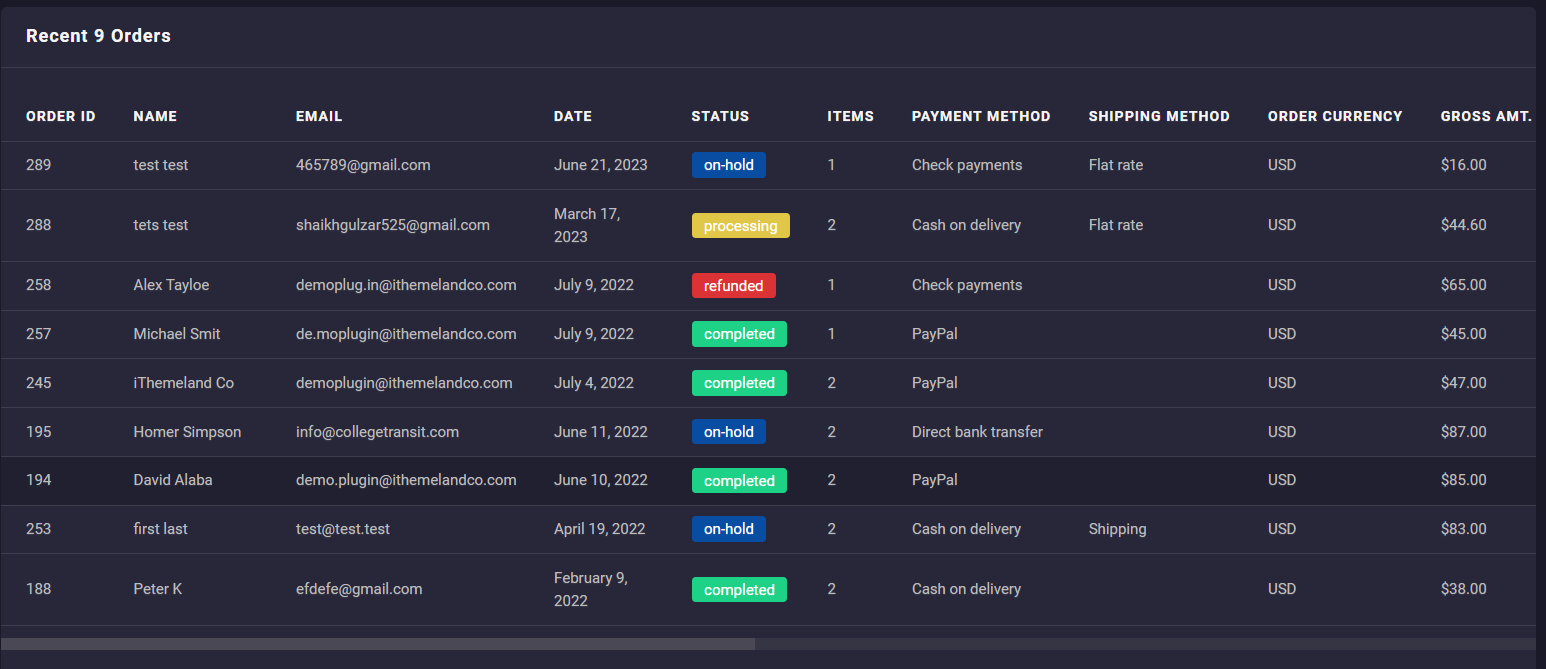
Recent orders table
The next table in the Dashboard is a brief report about the Recent 9 Orders. Here, you can find some practical information like their status, payment method, shipping, currency, etc.
Top customers
The final table is a report about the top 10 customers which is important for managers when they want to promote their loyal customers. In this report you can find out which customers order more products from your online store in the interval date that you have set before.